nova250 Touch Panel
Standard application
7001064003 T1 Sauter Systems 27
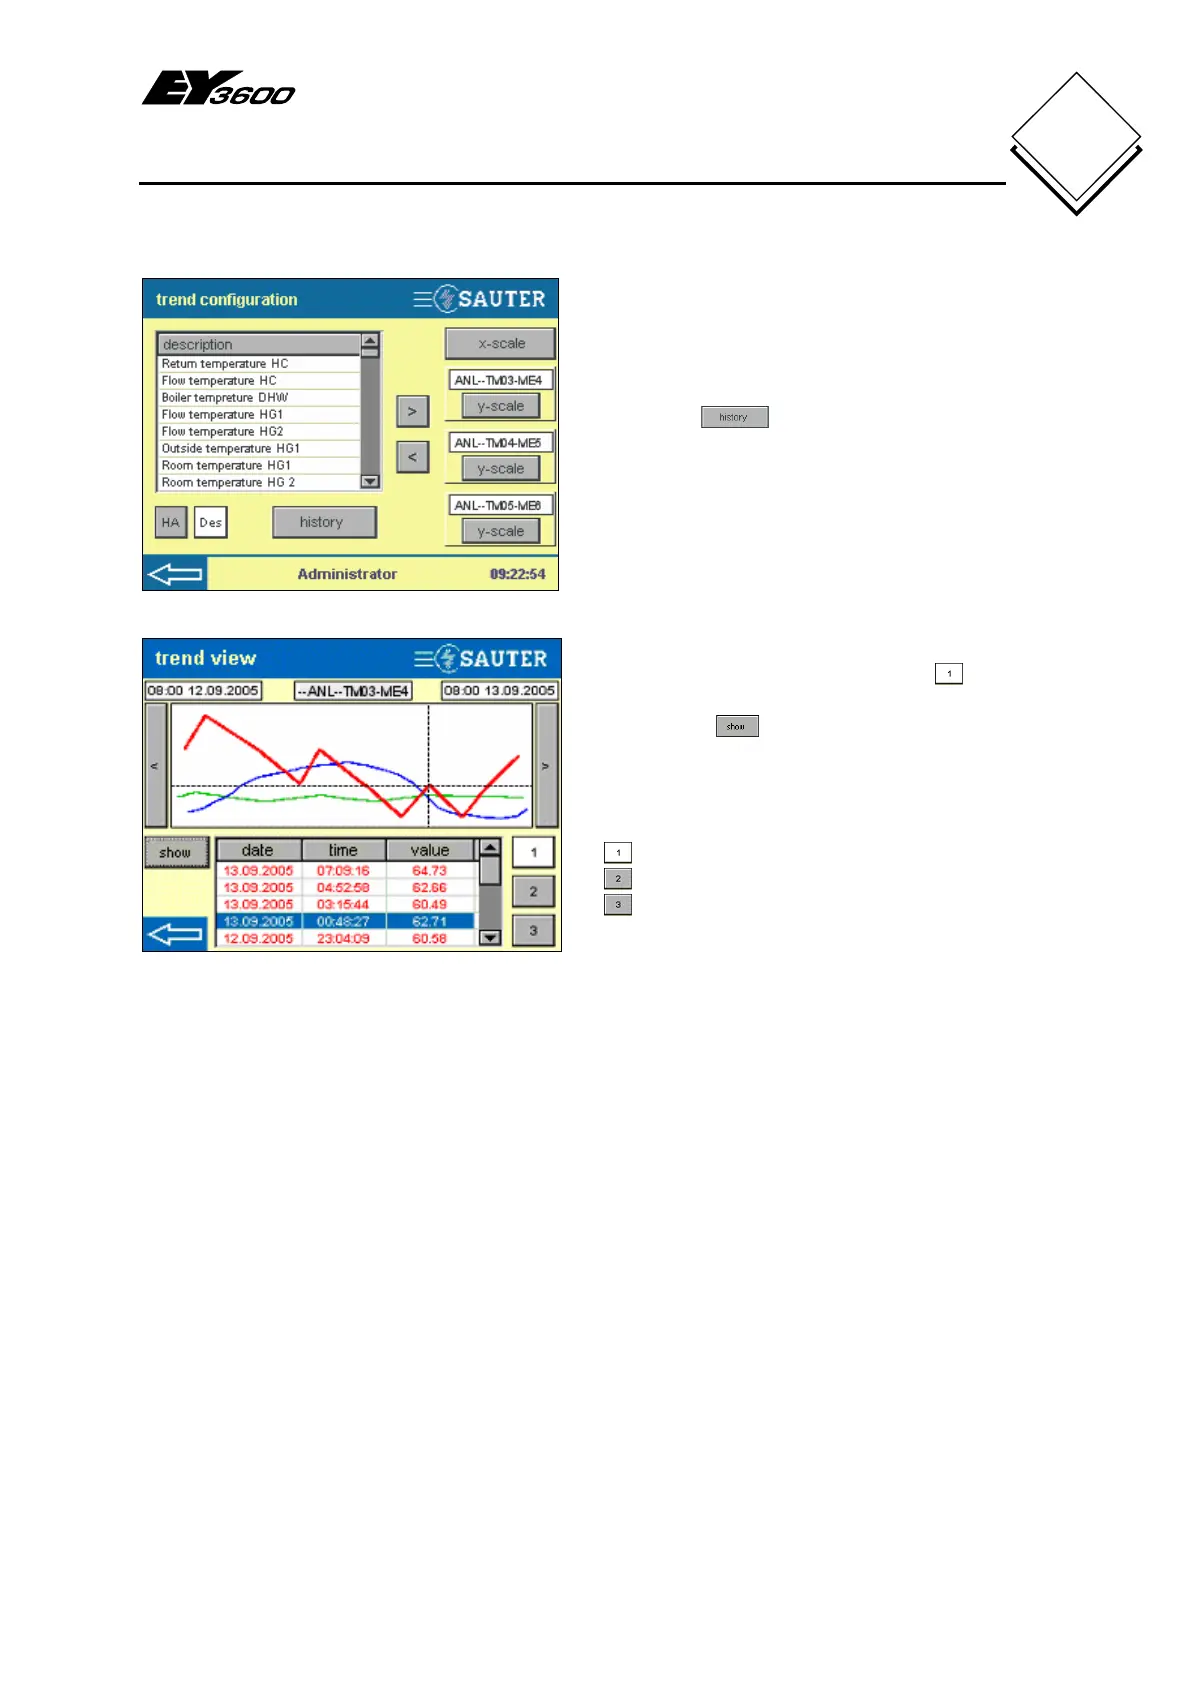
The next illustrations show an example of a plant and its historical data.
Fig. 4-22: HDB Configuration, Example
Fig. 4-22 shows an example with data
points for a heating plant. The maximum
of three data points have been added, and
by pressing
they could be shown
as a graphic as depicted in Fig. 4-23.
In this case, the house address was
deactivated in the list view, so only the
description of the data points in the list is
shown.
Fig. 4-23: HDB View, Example
The first data point is activated with .
The HDB entry with value 62.71 is
selected and
is pressed to highlight it
with dotted lines.
The colours for the three curves are
permanently defined:-
= red
= green
= blue