nova250 Touch Panel
Standard application
7001064003 T1 Sauter Systems 25
4.4 Historical data
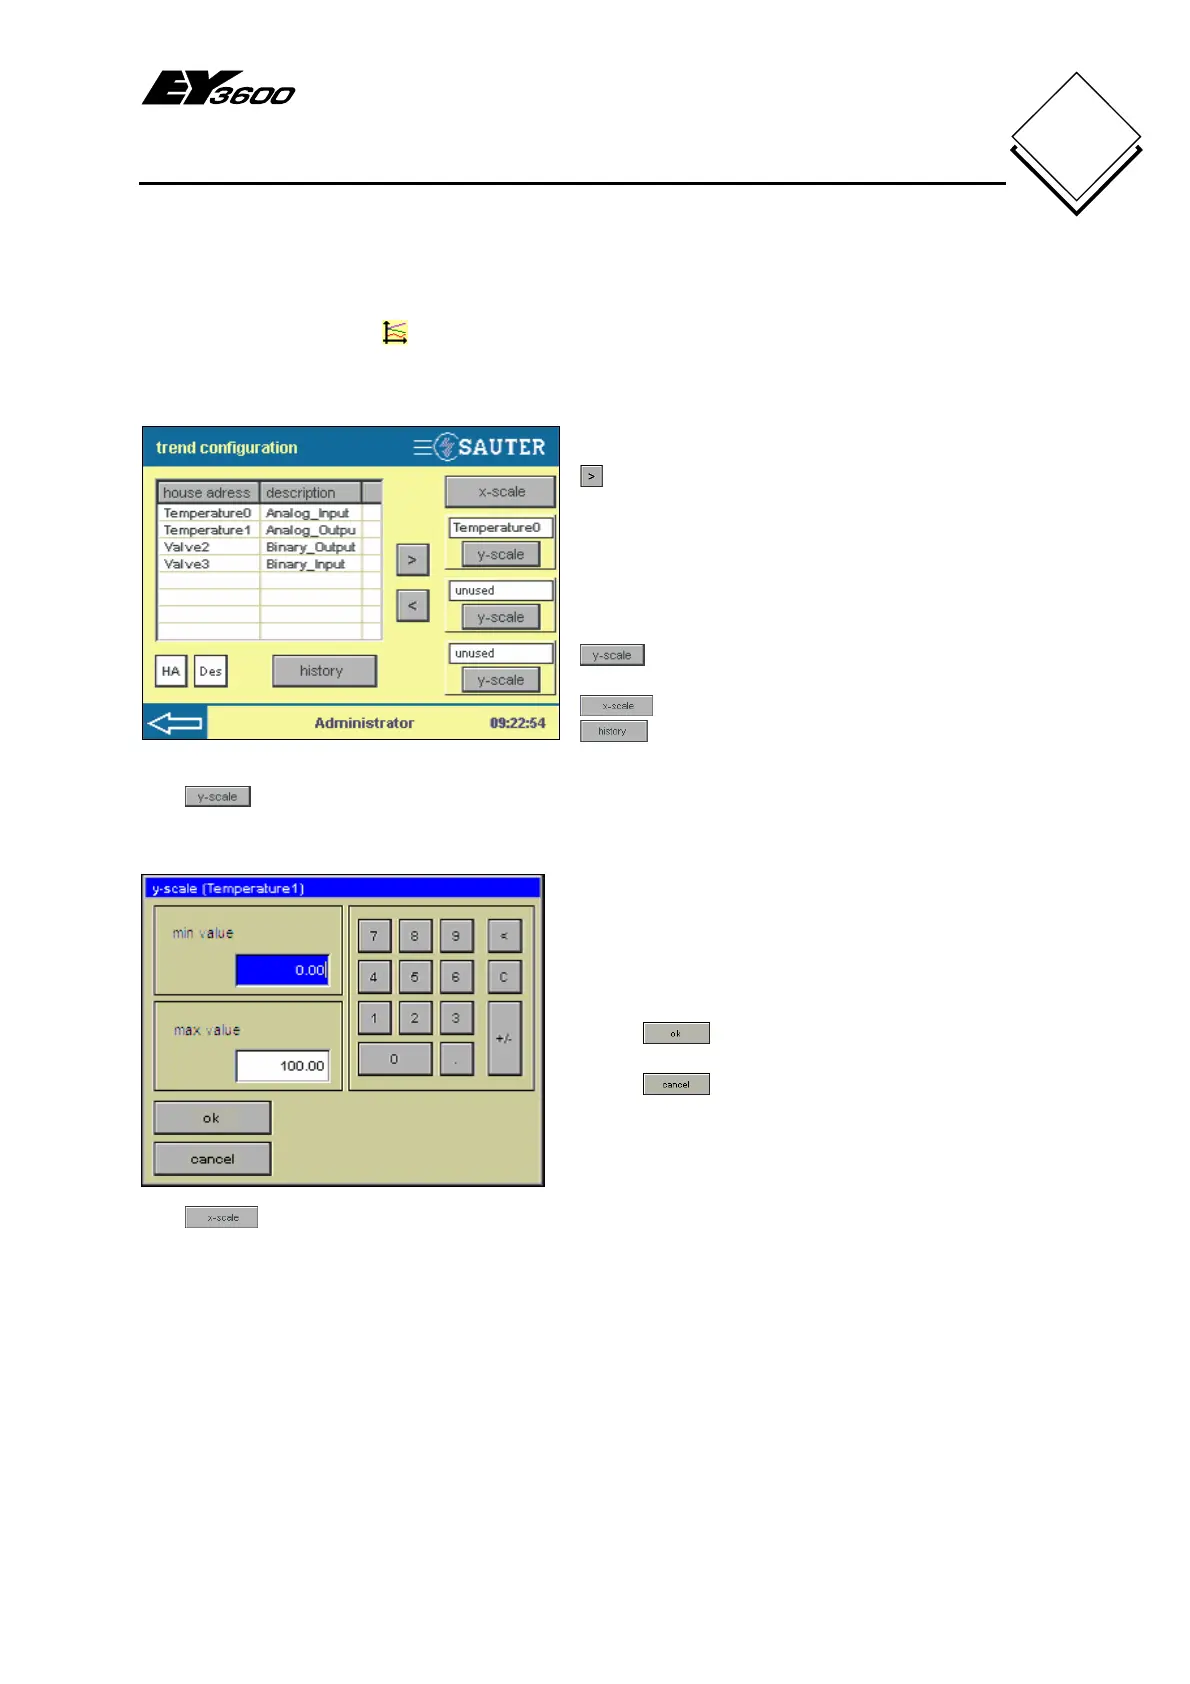
Press the historical data button in the data-point list to open a window with a list of all
data points (Fig. 4-18). This is the 'interactive' configuration for the graphic view of
historical data for up to three data points.
Fig. 4-18: HDB Configuration
Select the data point and add it by pressing
. The house address appears in the
blank 'unused' box.
When you add an analogue value, the Y-
scale window opens (Fig. 4-19). The Y-
scale is not active for binary values.
: definition of the value range in the
Y-scale
: definition of the time axis
: read and show historical data
The
buttons allow you to adapt the defined minimum and maximum Y-scale
values for the relevant data points that were added.
Fig. 4-19: Value Range, Y-scale
In this window, you can define the Y-scale
for the data point with min. value and
max. value by pressing the number keys
(also see Fig. 4-6).
Press
to confirm your entry.
Press
to return to HDB
configuration (Fig. 4-18), without making a
change.
The
button allows you to adapt the time axis for the graphic HDB view.