Operations Manual Perdix
Manual DocRev B
26
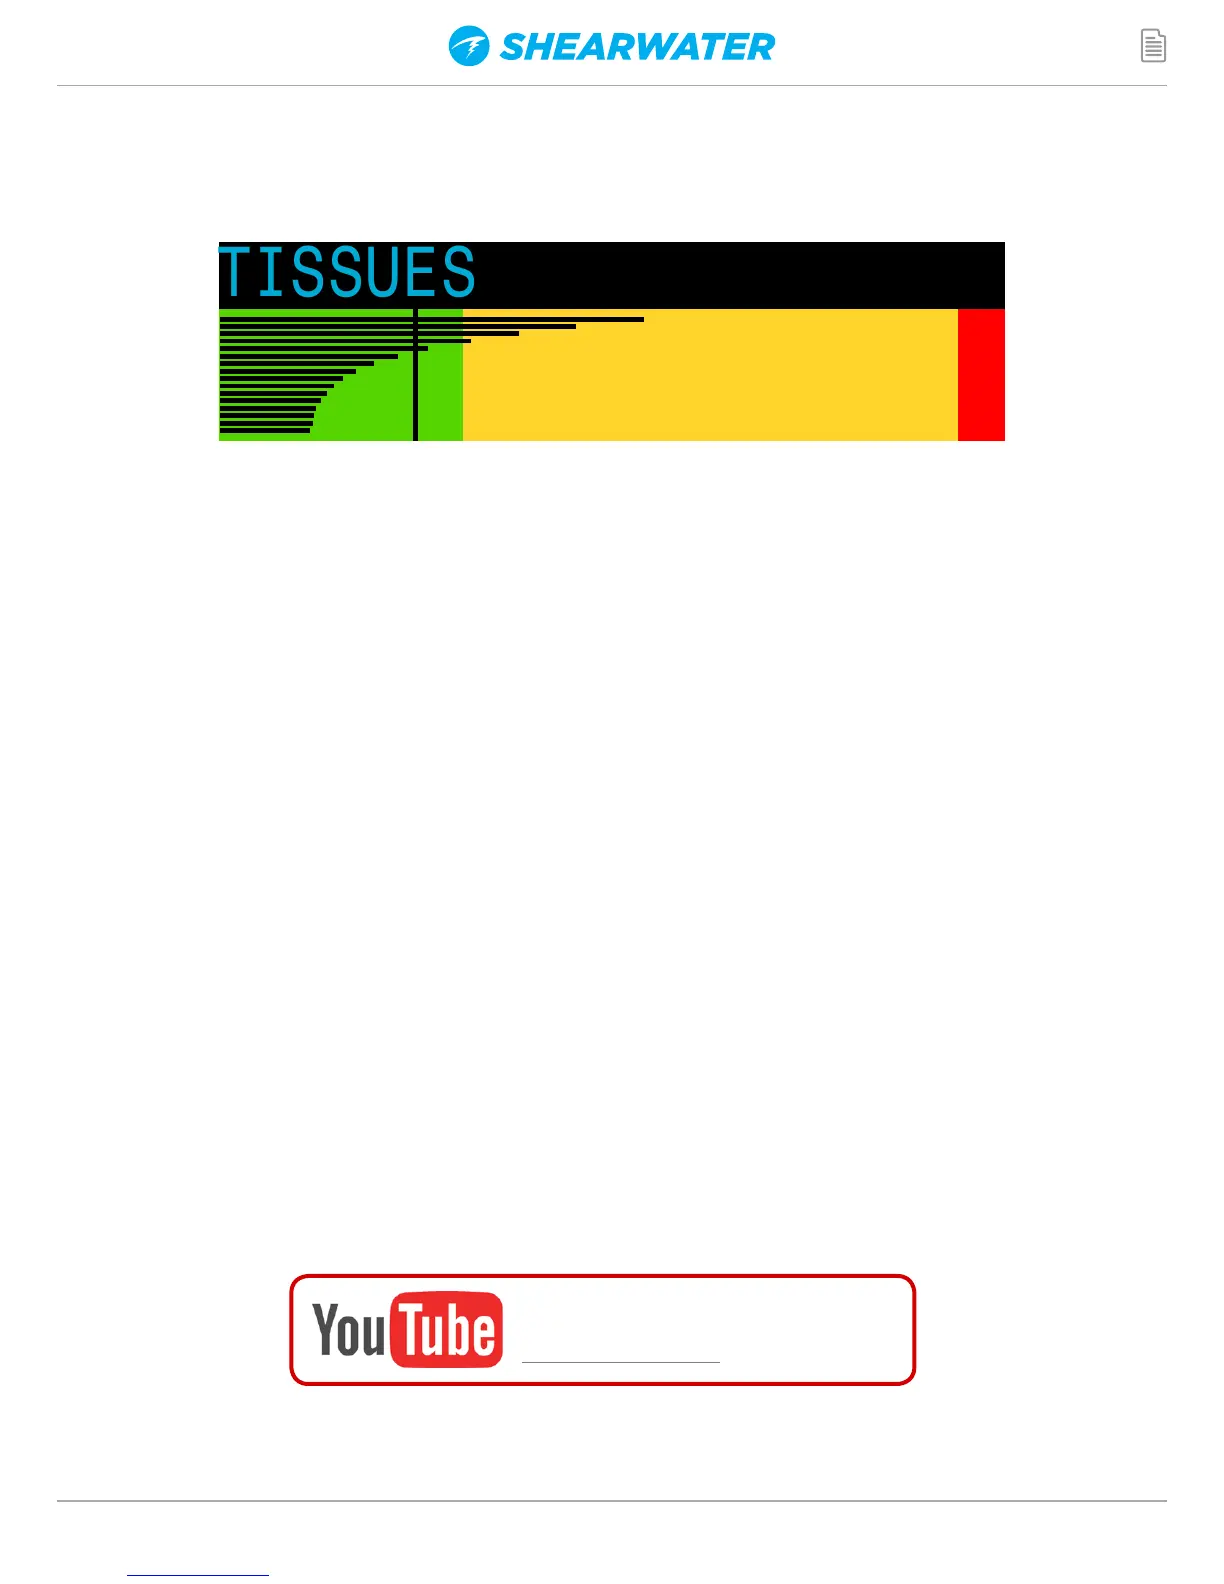
Tissues Bar Graph
The tissues bar graph shows the tissue compartment inert gas
tissue tensions based on the Bühlmann ZHL-16C model. Note that
VPM-B also tracks tensions in the same way.
The fastest tissue compartment is shown on the top, and the slowest
on the bottom. Each bar is the combined sum of the nitrogen and
helium inert gas tensions. Pressure increases to the right.
The vertical black line shows the inert gas inspired pressure. The
boundary between the green and yellow zones is the ambient
pressure. The boundary between the yellow and red zone is the
ZHL-16C M-Value pressure.
Note that the scale for each tissue compartment above the green
zone is different. The reason the bars are scaled in this way is so
that the tissues tensions can be visualized in terms of risk (i.e.
how close they are as a percentage to Bühlmann's original super-
saturation limits). Also, this scale changes with depth, since the
M-Value line also changes with depth.
Watch the video:
Tissues Demo
The video below demonstes how to interpret the tissues bar graph on a
Shearwater Petrel. The Perdix's tissue bar graph is identical.
 Loading...