Analyzing QC Samples
6. Press 1 - 4 to select the QC level. This makes sure the result is
compared to the appropriate QC reference range, and reported
correctly on the printer and DMS systems. If QC level is not
selected the 248 assumes Level X, which has no range checking.
Example result If the measured values are outside the QC ranges set
(see Section 5, Configuring the System) an arrow indicates if they are
above or below the range.
Example Printout
QC ReportQC Report
QC ReportQC Report
QC Report
248-9265 11:15 Apr 11 1994 Instrument ID, time and date,
Sample No. 5062 and sample number
Level 1Level 1
Level 1Level 1
Level 1
Lot 123456
pH 7.143
pCO
2
69.4 mmHg Measured values
pO
2
66.5 mmHg
QC RangesQC Ranges
QC RangesQC Ranges
QC Ranges
pH 7.127 - 7.167
pCO
2
67.1 - 77.1 QC ranges
pO
2
59.4 - 69.4
--------------------------------
--------------------------------
----------------
While the results are displayed and printed the 248 washes the probe
and sample path.
When the wash has finished the 248 returns to the Ready screen.
The Ready screen main message will show QC sample for 60 seconds.
After this time, the screen reverts to the last sample type before QC
was selected.
press * to cancel
Page 2-12 248 Operator’s Manual
Measuring
pH = 7.392
pCO
2
mmHg = 41.7
pO
2
mmHg = 78.4
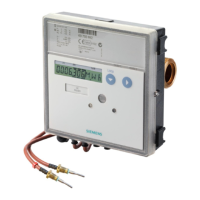
Results - QC Level 1
Measured Range
pH = 7.143 7.127 - 7.167
pCO
2
mmHg = 69.4 67.1 - 77.1
pO
2
mmHg = 66.5 59.4 - 69.4
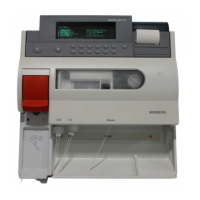
Select QC Level
1 Level 1
2 Level 2
3 Level 3
4 Level X
press 1 – 4