A D D I T I O N A L F E A T U R E S
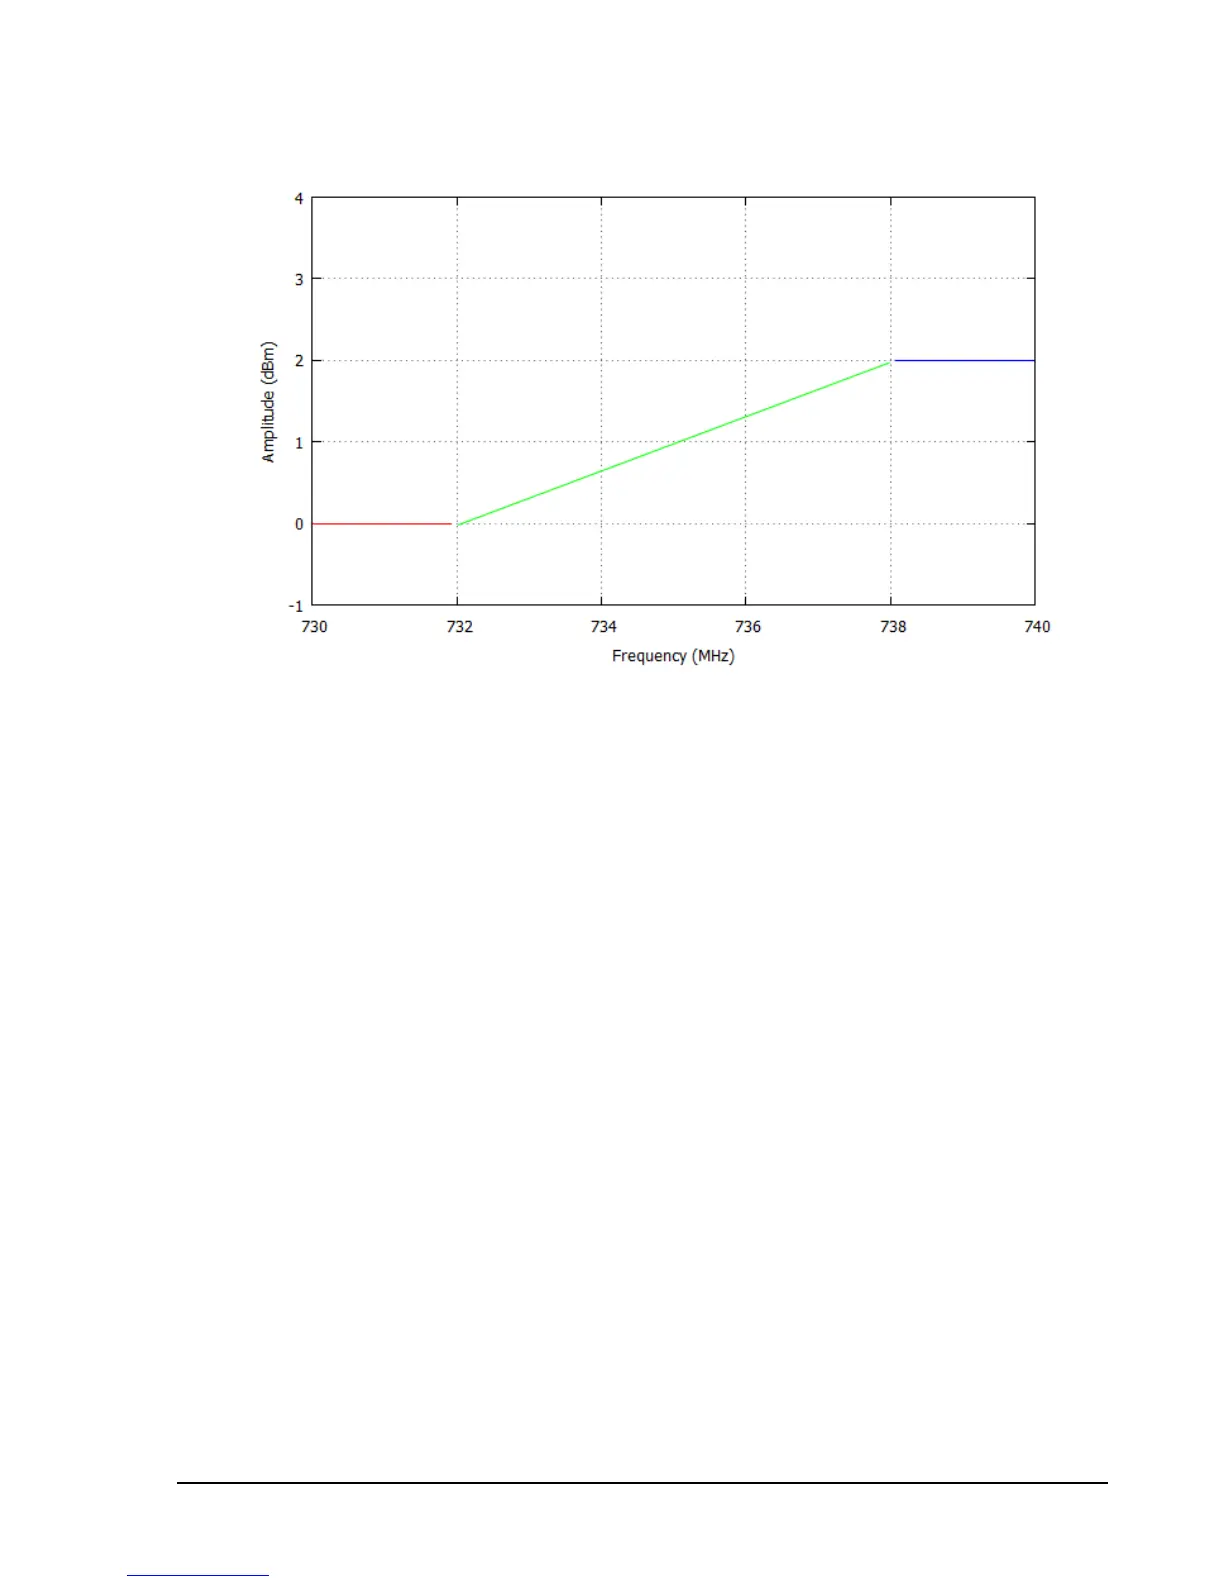
We can see the linear interpolation between the two points and flat lines off the sides.
The format for limit lines is very similar. Each line with contain two or three values. If you only
want a max limit line, each line of the CSV will contain two values, if you want max and minimum
limit lines, each line will contain three values. The first value will be a frequency in MHz, followed
by the (optional) minimum amplitude in dBm, and the maximum amplitude in dBm.
The limit lines are drawn on the graticule and every trace is tested against them. Indicator text will
appear in the center of the screen denoting whether the trace currently shown passes or fails the
limit line test.
 Loading...