D I S P L A Y M O D E S
7 Display Modes
The BB60 provides you with many ways to view the spectrum. Each type of display is useful for
different purposes. Below is an introduction to some of the views.
Spectrogram 7.1
The BB60 offers two visual representations of a spectrogram, the traditional spectral waterfall and a
three dimensional representation where amplitude is represented by color and height. Our spectrogram
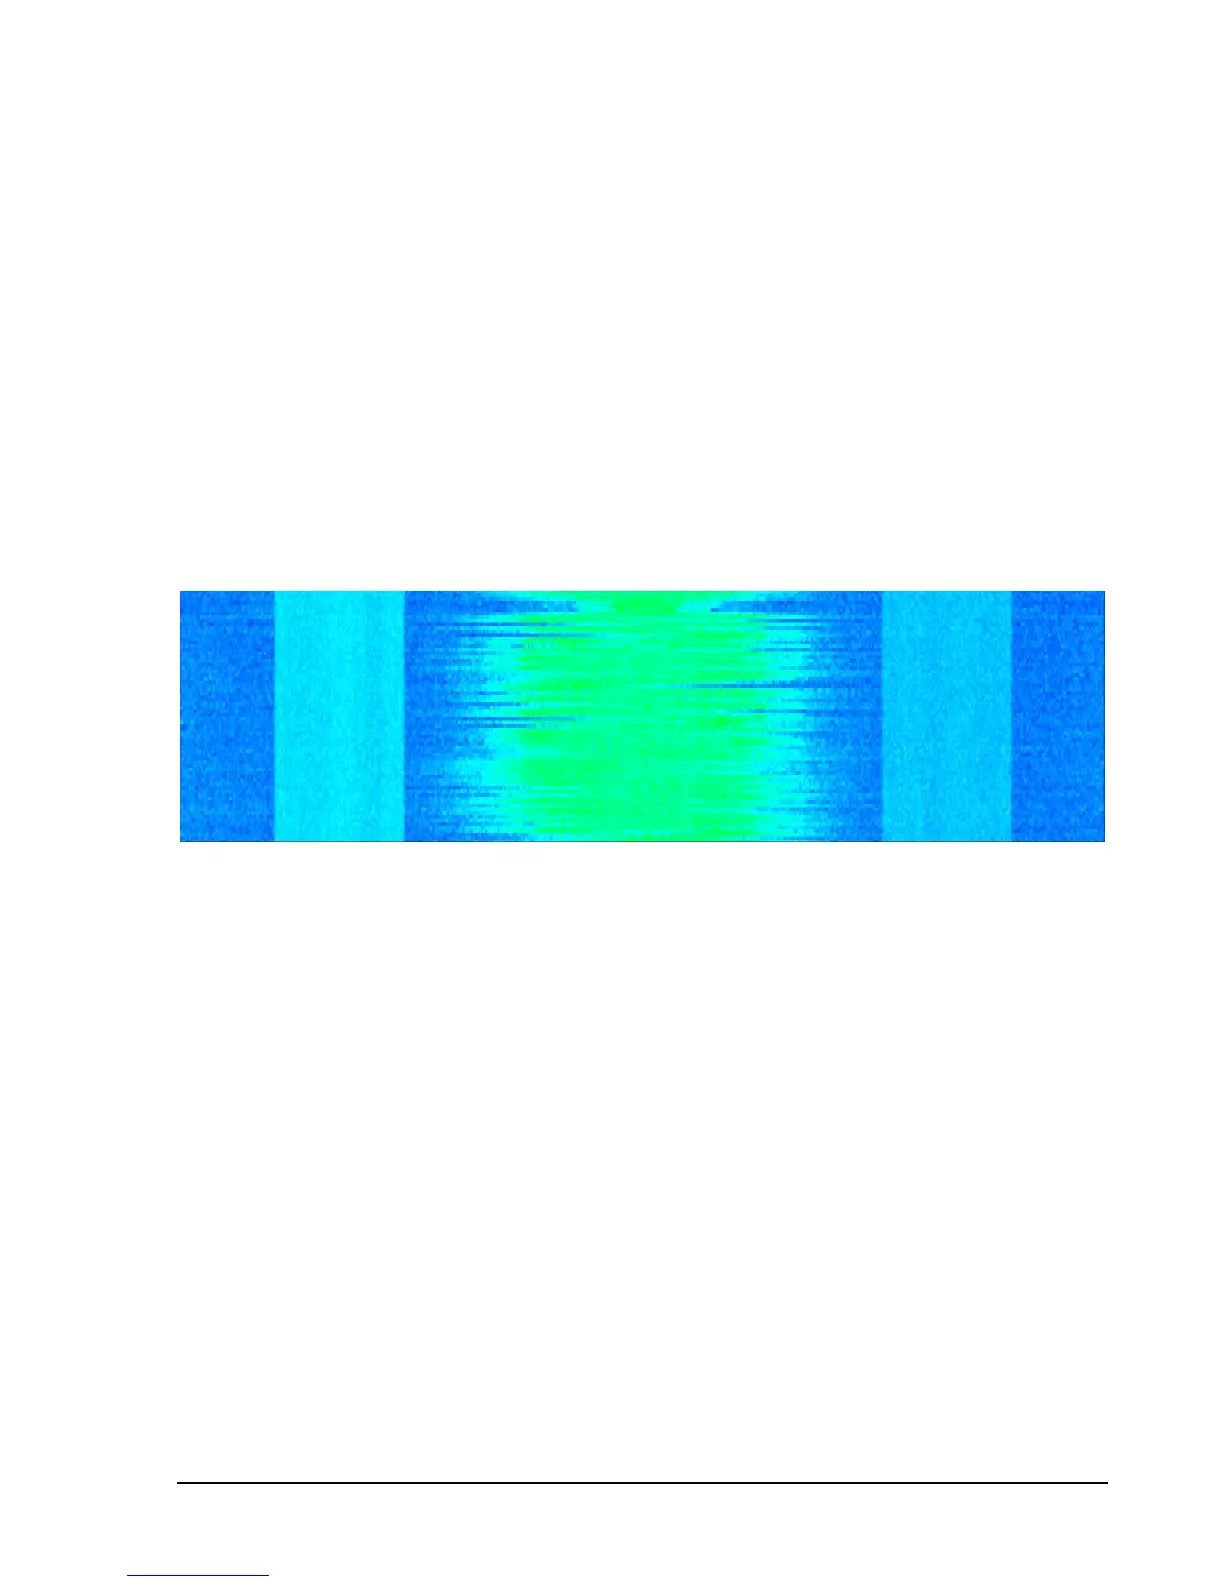
displays show spectral history of up to 128 sweeps. Below is an image of the spectral waterfall displaying
an FM station broadcasting with HD radio. The width of the view is representative of the selected span.
The colors along a horizontal line represent the amplitude of that given sweep. More recent sweeps
appear at the front (bottom) of the display. Low amplitudes are represented by blue, and as amplitude
increases, the color moves through the color spectrum, from blue to green to red.
Figure 2 : FM Station with HD Radio side bands
Persistence 7.2
The BB60 persistence display is helpful for viewing spectral density over time. Instead of showing a
single trace, persistence uses the last ‘n’ traces to create an image where color is representative of how
often a signal appears. The software uses the color spectrum to represent density over time. If a signal
rarely occurs in a location, a light blue is used to color the trace. If a signal continues to appear in the
same location the color will change from blue to green to red. Red is an indication of a signal persisting
in one location for a good deal of time.
 Loading...