Chapter 4: Connecting Environmental Sensors (Optional)
Control and Communication Gateway Installation Guide - MAN-01-00132-1.2
Example of Sensor Graph Configuration
The following is an example of setting a temperature sensor with the following specifications:
Measurement signal: 0..10V
Measurement range: -10...+70°C
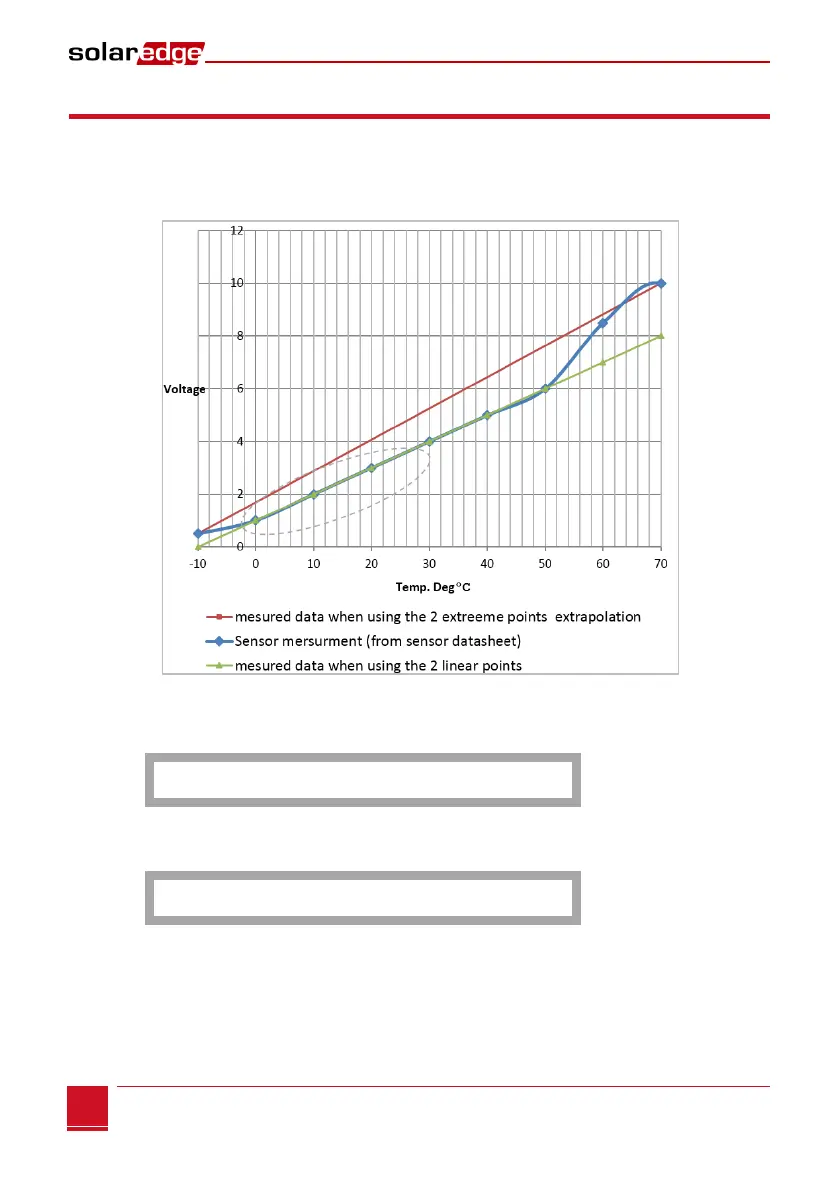
The following graph shows the min. and max. values, and the focused (linear) area.
Figure 17: Example of sensor graph
If you want to include the full range of the sensor, the points for setting are the minimum and maximum
values from the sensor datasheet:
P0 <0 , - 10>
P1 <10, 70>
However, if you want to include a partial range, set any value for the two points, as long as the points are
within the SolarEdge gateway selected range. The SolarEdge gateway then extrapolates the sensor linear
graph based on these two points.
P0 <1 , 0 >
P1 <5 , 50>