•s
*'
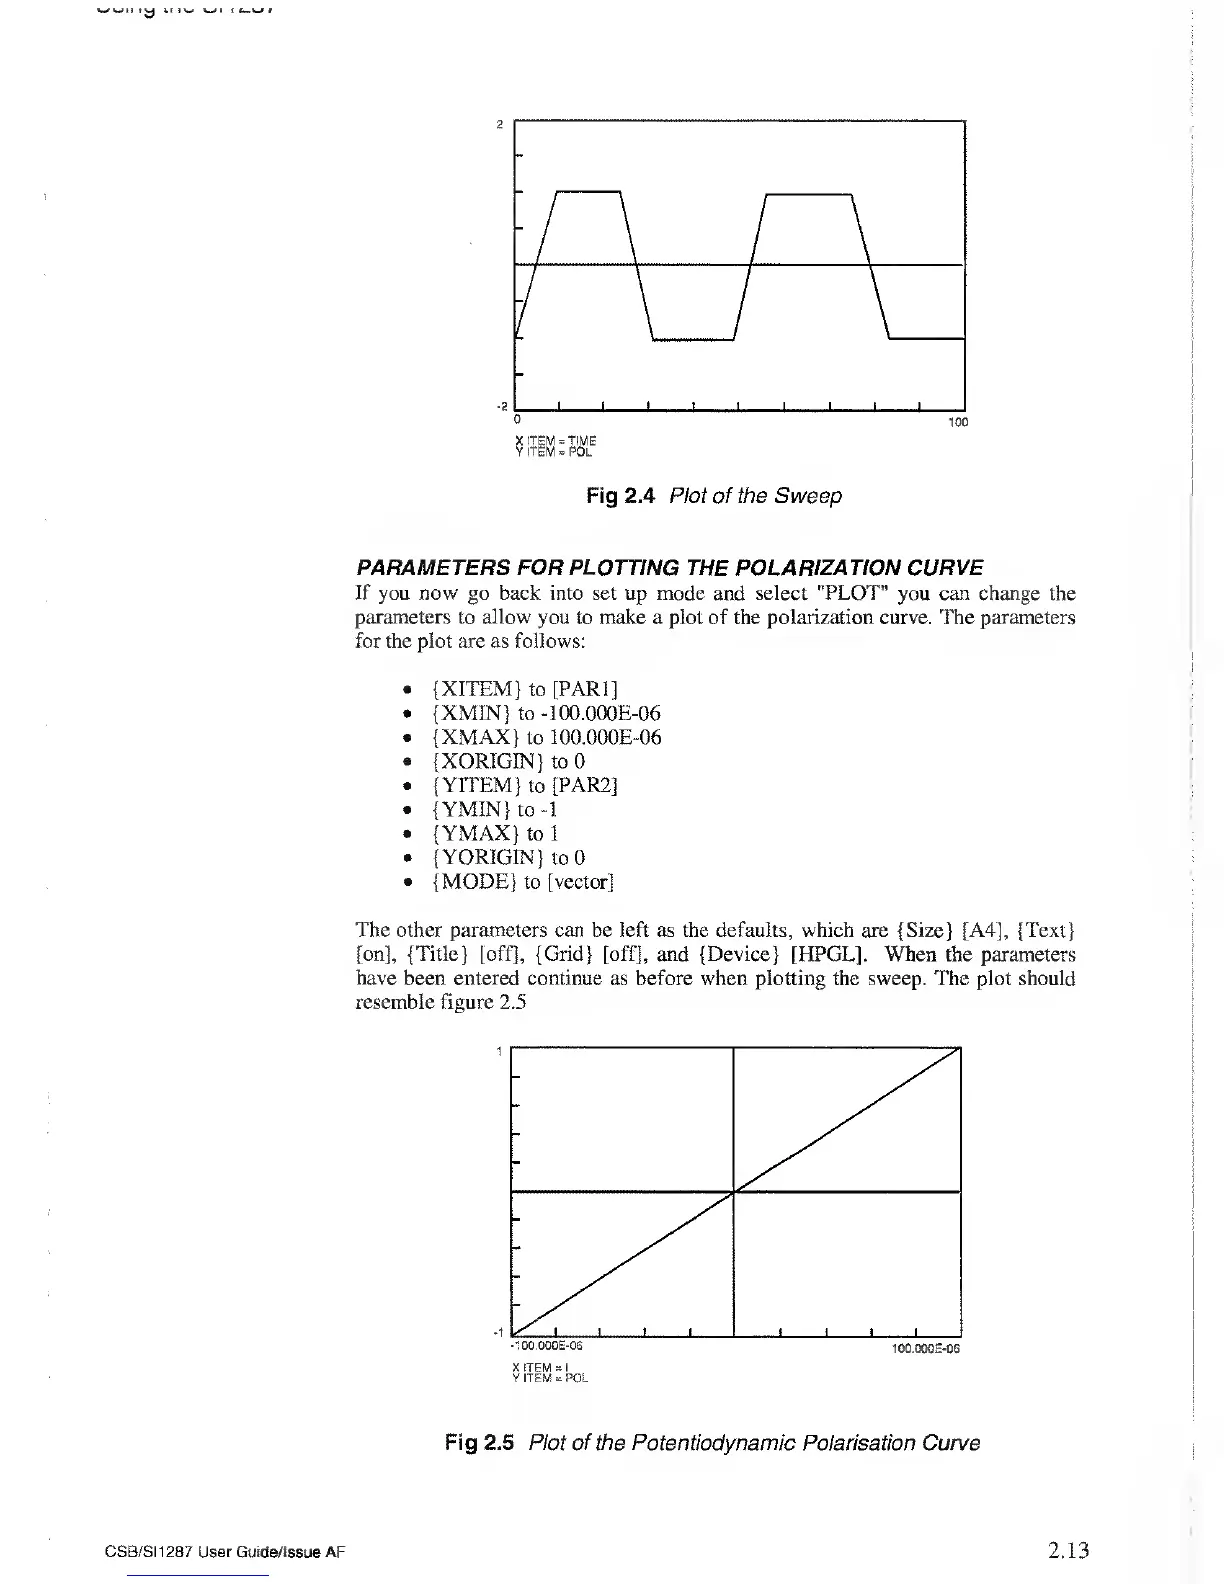
Fig 2.4 Plot of the Sweep
PARAMETERS FOR PLOTTING THE
POLARIZATION CURVE
If you now go back into set up mode and select "PLOT"
you
can change
the
parameters
to
allow
you to make a plot of the polarization curve. The parameters
for the plot are as follows:
• {XITEM} to [PARI]
•
{XMIN} to
-100.000E-06
• {XMAX} to 100.000E-06
• {XORIGJN}
to
0
• {YITEM} to [PAR2]
•
{ YMIN} to
-1
• {YMAX}
to
1
• { YORIGIN} to 0
•
{MODE}
to [vector]
The other
parameters can be left as the defaults, which are {Size} [A4], {Text}
[on], {Title} [off], {Grid} [off], and {Device} [HPGL]. When the parameters
have been entered continue
as before when
plotting
the sweep. The plot should
resemble
figure 2.5
-100.000E-06
100.000E-06
Fig 2.5 Plot of the Potentiodynamic
Polarisation Curve
CSB/SI1287 User
Guide/Issue AF
2.13