SC5 Signal Conversion Performance Measurements
46
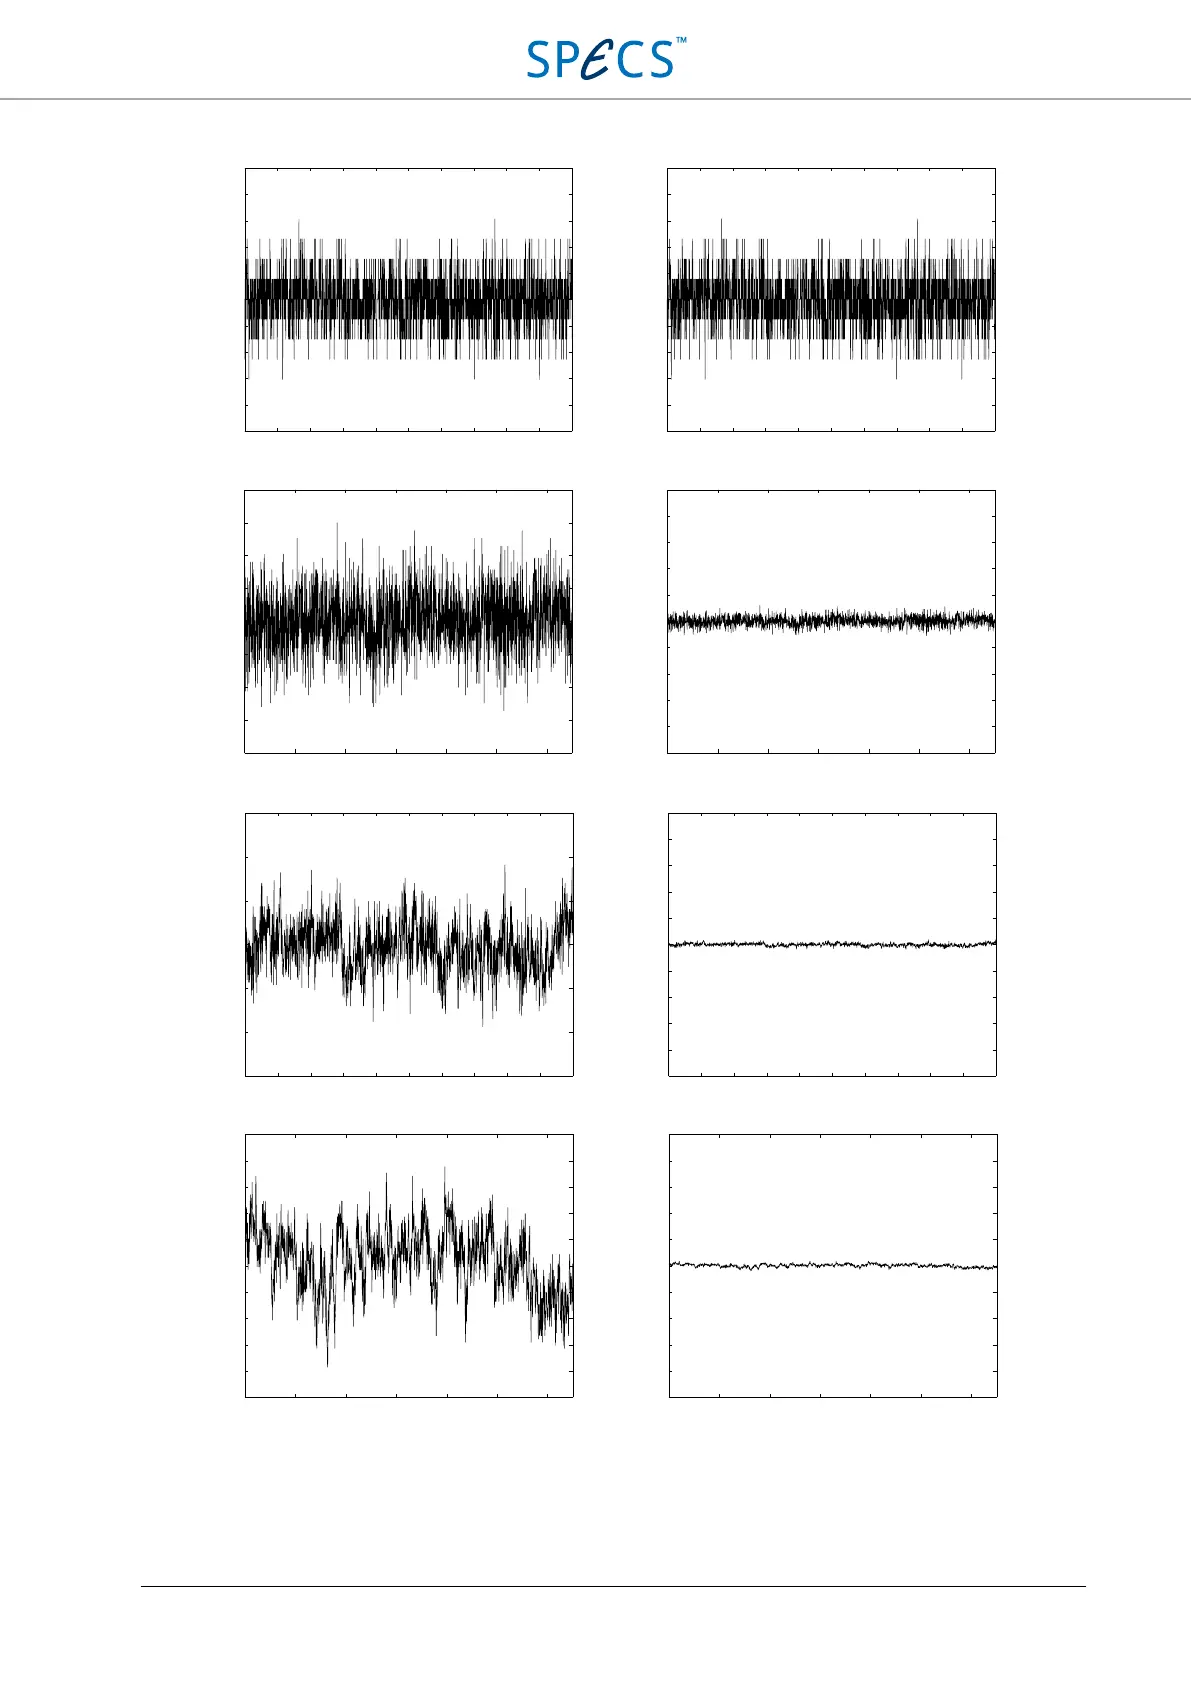
Figure 24: Input noise for different oversampling. The top row is for no oversampling, the second row for an
oversampling of 32 times, the third for 1024 times, and the lower one for 32768 times. Pictures in the left column have
different Y-scaling, while pictures in the right column have the same Y-axis scaling as for no oversampling, in order to
show the effect of oversampling.
0 0.2 0.4 0.6
0.8 1.
0
1.
2 1
.
4 1
.6
1
.8
2
.0
Time [ms]
Input noise voltage [mV]
0.5
0.
4
0.3
0.
2
0.1
0
-0.1
-0
.2
-0.3
-
0.
4
-0.5
I
n
p
u
t
r
a
n
g
e
:
±
1
0
V
Ov
er
s
am
pl
i
ng
:
1x
0 0.2 0.4 0.6 0.8 1.0 1.2 1.4 1.6 1.8 2.0
Time [ms]
Input noise voltage [mV]
0.5
0.4
0.3
0.2
0.1
0
-0.1
-0.2
-0.3
-0.4
-0.5
Input range: ±10 V
Oversampling: 1x
0 10 20 30 40 50 60
Time [ms]
Input noise voltage [μV]
In
p
ut
ra
n
ge
: ±
1
0 V
O
ve
rs
a
mp
l
in
g:
3
2x
80
60
40
20
0
-20
-40
-60
-8
0
0 10 20 30 40 50 60
Tim
e [m
s]
Input range: ±10 V
Oversampling: 32x
Input noise voltage [mV]
0.5
0.4
0.3
0.2
0.1
0
-0.1
-0.2
-0.3
-0.4
-0.5
0 0.2 0.4 0.6 0.8 1.0 1.2 1.4 1.6 1.8
2.0
Time [s]
Input noise voltage [μV]
Input range: ±10 V
Oversampling: 1024x
30
20
10
0
-10
-20
-30
0 0.2 0.4 0.6 0.8 1.0 1.2
1.4 1.6 1.8 2.0
Time [s]
In
put
ran
ge: ±
10 V
Oversampling: 1024x
Input noise voltage [mV]
0.5
0.4
0.3
0.2
0.1
0
-0.1
-0.2
-0.3
-0.4
-0.5
0 10 20 30 4
0 50 60
Time [s]
Input noise voltage [μV]
Input range:
±10 V
Oversampling: 32768x
25
20
15
10
5
0
-
5
-10
-15
-20
-25
0 10 20 30 40 50 60
Time [s]
Input noise voltage [mV]
0.
5
0.
4
0
.3
0.2
0
.1
0
-0
.1
-0.2
-0.3
-0.4
-0.5
Inp
ut ra
nge
: ±1
0 V
Oversampling: 32
768x