SC5 Signal Conversion Performance Measurements
71
Input voltage Gain error
-10 V < 0.6‰
+10 V < 0.6‰
Table 22: Maximum gain error of the SC5 fast analog output.
Frequency response
The frequency response of the fast analog output is measured with the output connected directly to a Nanonis OC4,
which has an analog bandwidth of 5 MHz. Since the filter cut-off frequency is larger than the Nyquist frequency, the
frequency response shows the effect of undersampling, and is therefore not the frequency response of the analog
output stage. Specifications of the output stage are -0.8 dB at 500 kHz and -2.7 dB at 1 MHz.
The following settings have been used for the measurement:
OC4
Measured output: Fast AO Input range: 1 V
Output amplitude: 1V
Output waveform: Sine wave
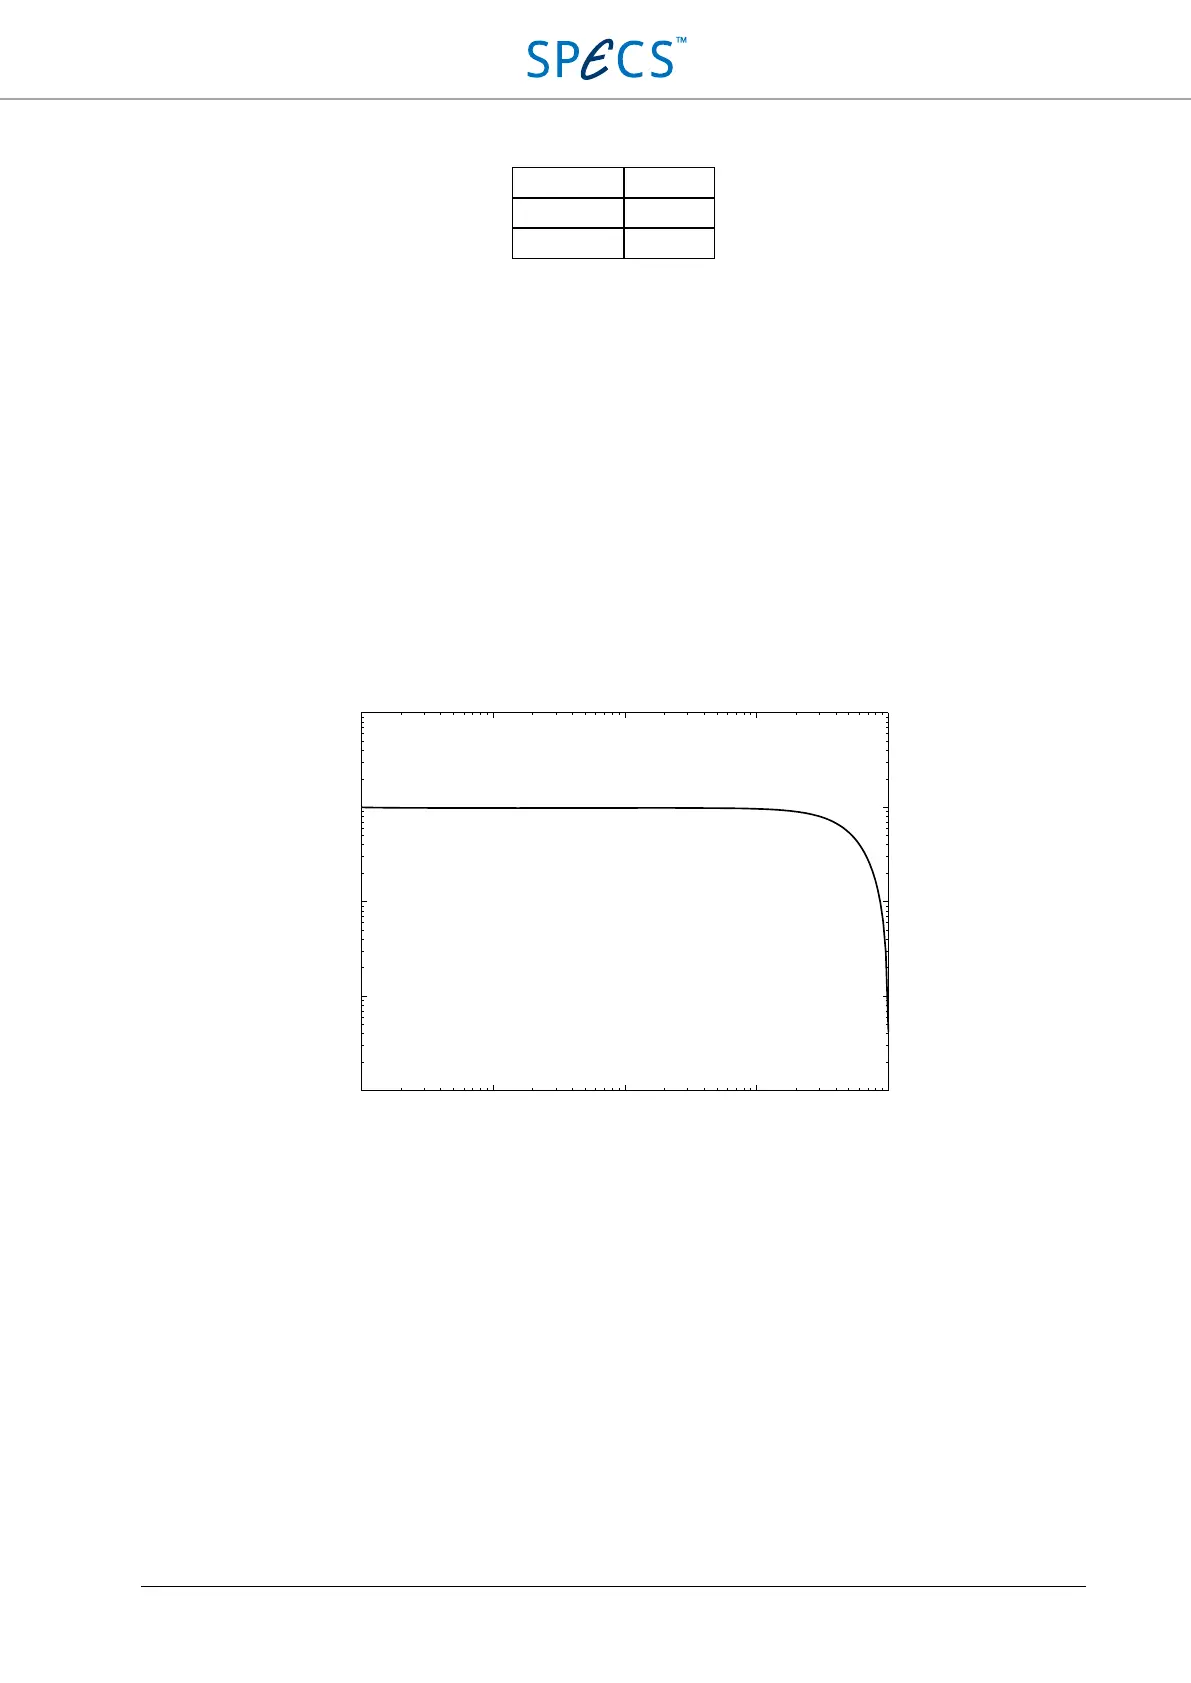
Figure 54: Signal response of the SC5 fast analog output from 100 Hz to 1 MHz. Due to undersamplig, the signal
amplitude decreases significantly below the filter cut-off frequency of 1.1 MHz.
10
2
10
3
10
4
10
5
10
6
10
−3
10
−2
10
−1
10
0
10
1
Output voltage [V]
Frequency [Hz]