SC5 Signal Conversion Performance Measurements
47
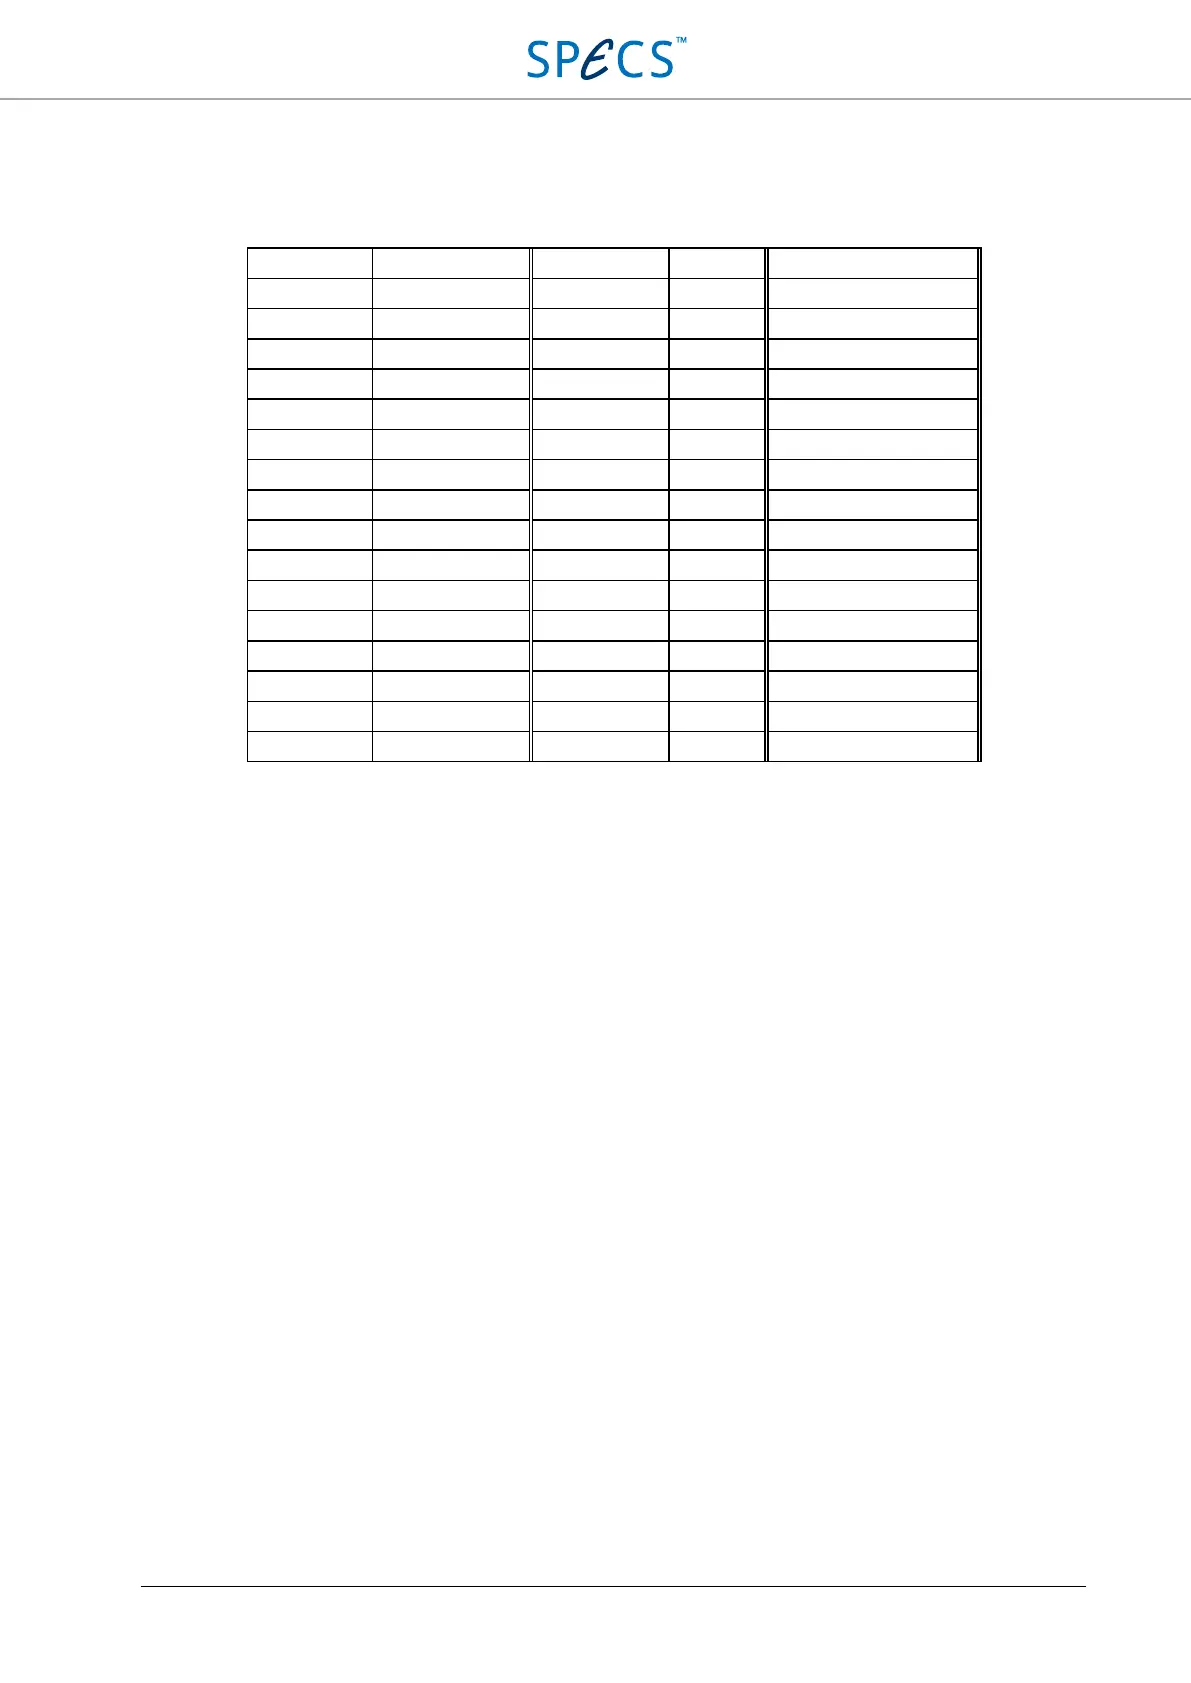
The following table summarizes the input noise values as a function of oversampling, measured with input
connected to GND, and the effective resolution. Note that the oversampling rate determines the maximum
measurement bandwidth, while the measurement time determines the minimum measurement bandwidth.
Oversampling Measurement BW Peak-peak (µV) RMS (µV) Effective resolution (bits)
1x 489 Hz – 500 kHz 665 99 17.62
2x 244 Hz – 250 kHz 480 71 18.10
4x 122 Hz – 125 kHz 345 50 18.61
8x 61 Hz – 62.5 kHz 245 35 19.12
16x 30.5 Hz – 31.3 kHz 175 25 19.61
32x 15.3 Hz – 15.6 kHz 125 18 20.08
64x 7.6 Hz – 7.8 kHz 93 14 20.45
128x 3.8 Hz – 3.9 kHz 71 10 20.93
256x 1.91 Hz – 1.95 kHz 56 8.1 21.24
512x 0.95 Hz – 977 Hz 49 6.9 21.47
1024x 0.48 Hz – 488 Hz 43 6.3 21.60
2048x 0.24 Hz – 244 Hz 42 6.2 21.62
4096x 0.12 Hz – 122 Hz 41 6.2 21.62
8192x 0.06 Hz – 61 Hz 41 6.2 21.62
16384x 0.03 Hz – 30.5 Hz 41 6.2 21.62
32768x 0.015 Hz – 15.3 Hz 40 6.4 21.58
Table 3: Input noise voltage and effective resolution as a function of oversampling for inputs connected to GND. Above an
oversampling of 1024x, noise reduction through oversampling is limited by 1/f noise.
Analog inputs DC performance measurements
DNL and INL
The differential (DNL) and integral (INL) nonlinearities are measured with AI1 of the SC5 input connected directly
to AO1. Since the DNL and INL of the analog outputs is much lower than the same parameters for the analog inputs,
the nonlinearities of the outputs are negligible. During these measurements the environment temperature was not
kept constant, meaning that in a constant-temperature environment the results for the INL would show a lower INL
than in the measurement below.
The first plot shows the differential nonlinearity, the second the integral nonlinearity. INL is strongly affected by
input drift.
 Loading...