SC5 Signal Conversion Performance Measurements
44
Performance Measurements
Analog inputs noise performance measurements
Spectral noise
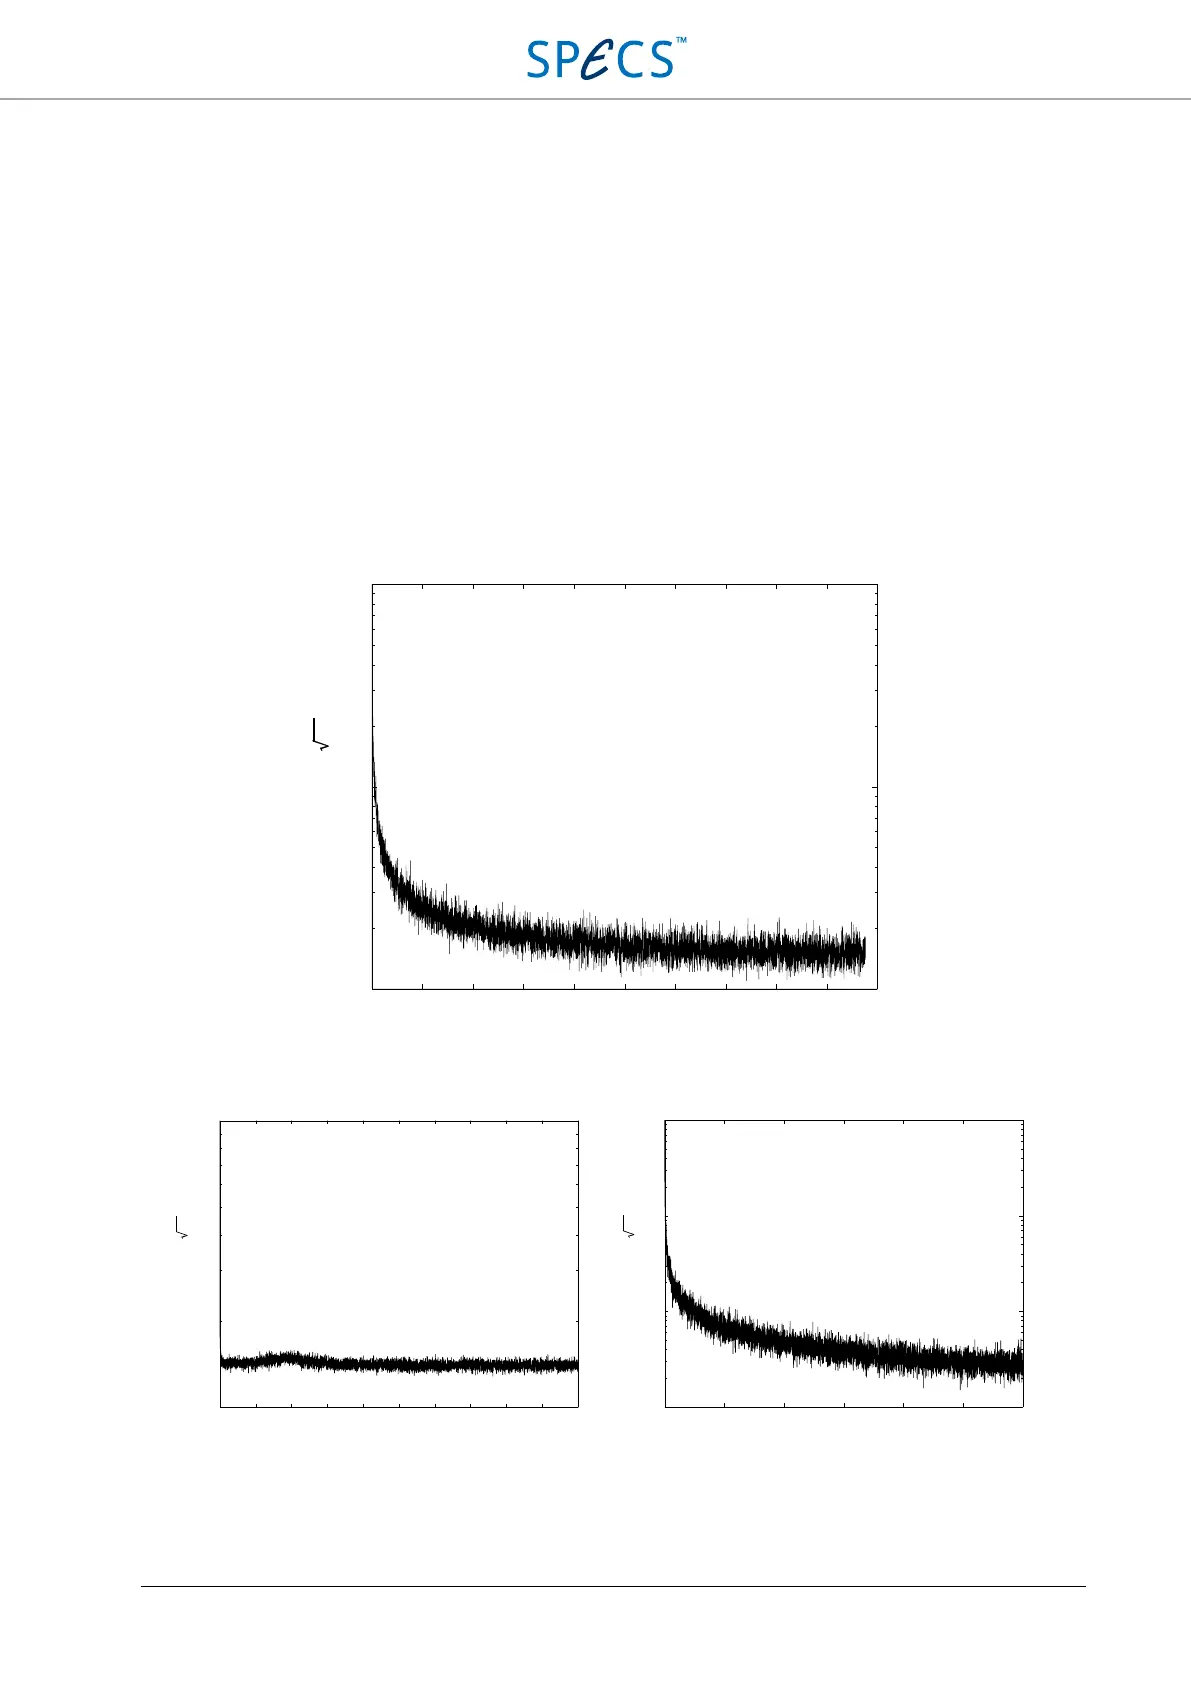
The noise spectrum of the analog inputs is measured with the inputs connected to GND, using the internal switch.
All measurements are for AI1. The pictures below show the noise spectrum for the range of 1 kHz, as well as the full
sampling range (500 kHz) and the frequency range (below 60 Hz). The FFTs have 20 000 points.
Figure 22: Spectral noise of the analog inputs up to a frequency of 1 kHz.
Figure 23: Spectral noise of the analog inputs showing the full sampling range (left), and the low frequency range below 60
Hz (right). The analog bandwidth is 100 kHz, as can be seen from the decrease in noise around that frequency in the left
plot.
0 1
00 2
00
300
4
00
50
0 60
0 70
0 80
0 90
0
10
00
F
re
q
ue
nc
y
[H
z]
10000
1
000
1
00
Input range: ±10 V
Oversampling: 512x
Spectral noise [nV/ Hz]
0 10 20 30 40 50 60
Frequency [Hz]
Spectral noise [μV/ Hz]
100
10
1
0.1
Input range: ±10 V
Oversampling: 8192x
0 50 100 150 200 250 300 350 400 450 500
Frequency [kHz]
Spectral noise [nV/ Hz]
1000
100
Input range: ±10 V
Oversampling: 1x