SC5 Signal Conversion Performance Measurements
52
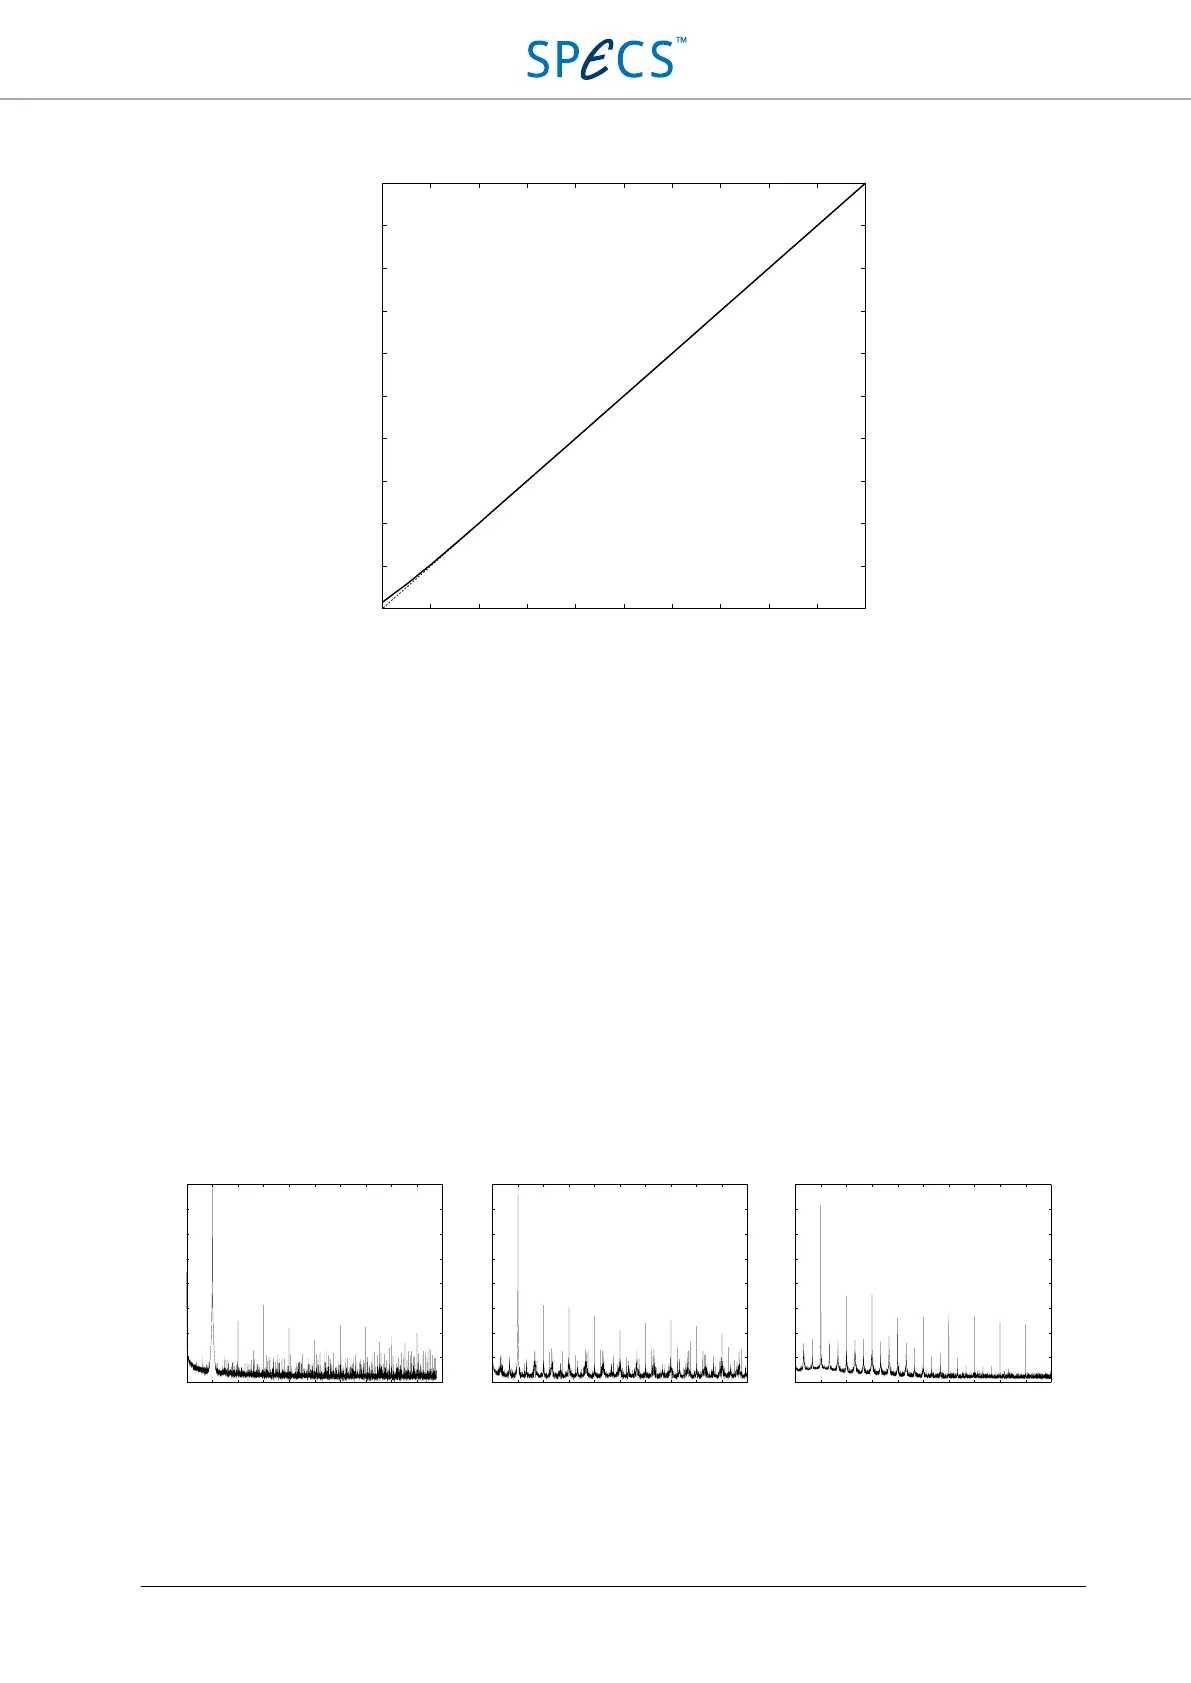
Figure 30: Linearity of the analog inputs of the SC5. The dotted line corresponds to ideal linearity.
Harmonic distortion
Harmonic distortion is measured for frequencies of 100 Hz, 1 kHz and 10 kHz with AO1 connected to AI1.
Additionally, measurements with 900 mV and 90 mV amplitude are repeated with a NI PXIe-5442 Arbitrary
waveform generator. Oversampling is adjusted in order to display up to 10x the signal frequency, and the FFT has a
resolution of 20 000 points.
The measured quantities are SINAD (SIgnal to Noise And Distortion), THD+N (Total Harmonic Distortion plus
Noise), THD (Total Harmonic Distortion), and SFDR (Spurious Free Dynamic Range). The measurements are done
for amplitudes of 9 V (corresponds to 18 Vp-p), 900 mV and 90 mV, without using voltage dividers. Note that
harmonic distortion measurements also include harmonic distortion of the output signal of the SC5 and the
waveform generator, meaning that the numbers are a lower boundary.
9 V amplitude
The following picture shows FFT spectra for 100 Hz (left), 1 kHz (center) and 10 kHz (right) signals at 9 V
amplitude.
Figure 31: Input harmonic distortion measurements for a 9 V signal at 100 Hz (left), 1 kHz (center), and 10 kHz (right).
-
1
00
-80 -60 -40 -20-90 -70 -50 -30 -10 0
Set amplitude [dBFS]
Input amplitude [dBFS]
0
-10
-20
-30
-40
-50
-60
-70
-80
-90
-100
0 100 200 300 400 500 600 700 800 900
Frequency [Hz]
Intput [dBFS]
0
-20
-40
-60
-80
-100
-120
-140
-160
0 1 2 3 4 5 6 7 8 9 10
Frequency [kHz]
Input [dBFS]
0 10 20 30 40 50 60 70 80 90 100
Frequency [kHz]
Input [dBFS]
1000
SINAD: 87 dB
THD+N: 99.3 dB
THD: 99.5 dB
SFDR: 90.1 dBc
SINAD: 69.7 dB
THD+N: 72.8 dB
THD: 72.9 dB
SFDR: 72.2 dBc
SINAD: 101.4 dB
THD+N: 125.3 dB
THD: 125.5 dB
SFDR: 101.7 dBc
0
-20
-40
-60
-80
-100
-120
-140
-160
0
-20
-40
-60
-80
-100
-120
-140
-160