T15h Tag Deployment & User Guide
69
Include Readings
By default, the report will include readings received every hour during the
selected period. You can filter the readings according to Reporting Intervals by
using the Reporting Intervals drop-down menu (default is All). Uncheck
Include Readings to exclude the Readings from the report.
Include Graphs
Note: Graphs are only available when using PDF format.
Note: Not available for Contact Sensors.
By default, the report will include Graphs. The report will show a graph for
each tag sensor (1 graph for temperature and 1 graph for humidity). Uncheck
Include Graphs to exclude the Graphs from the report.
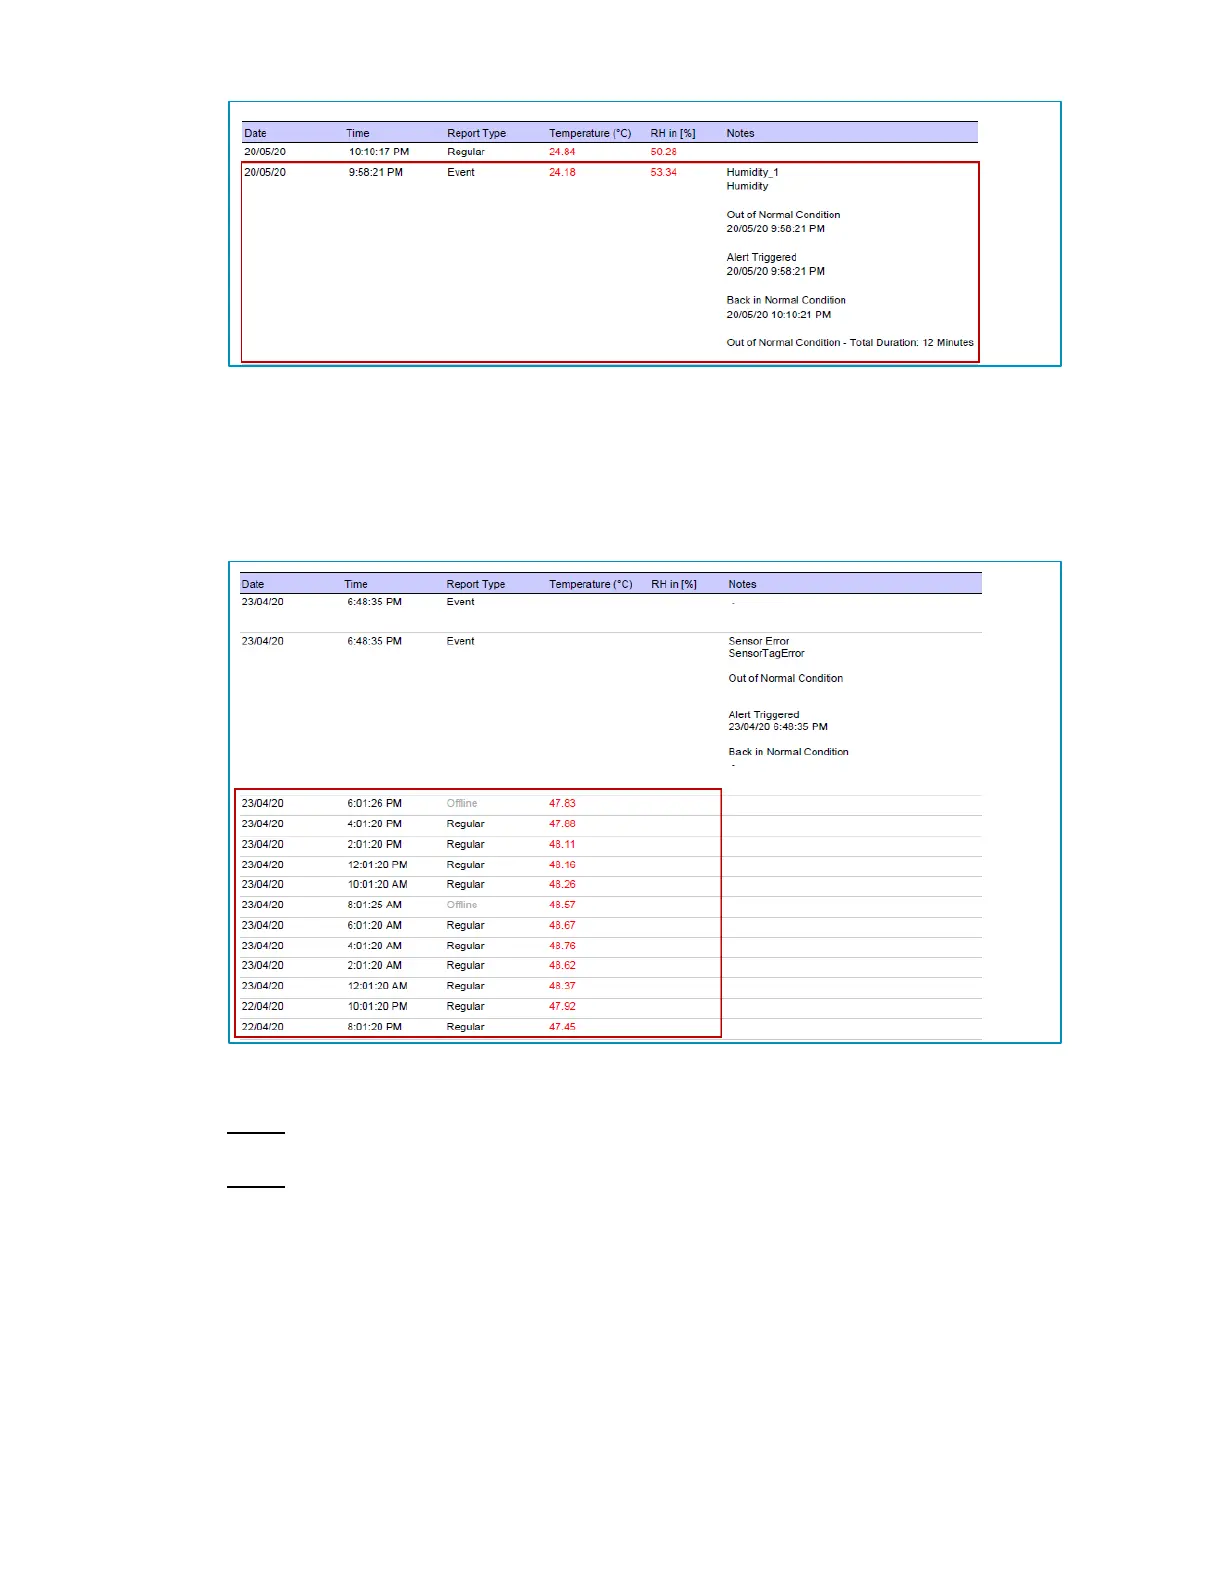
The following details are displayed in the report:
Asset Name
Asset ID
Temperature/Humidity Range (Red text - Critical)
 Loading...