32 5: Configuring Data Displays
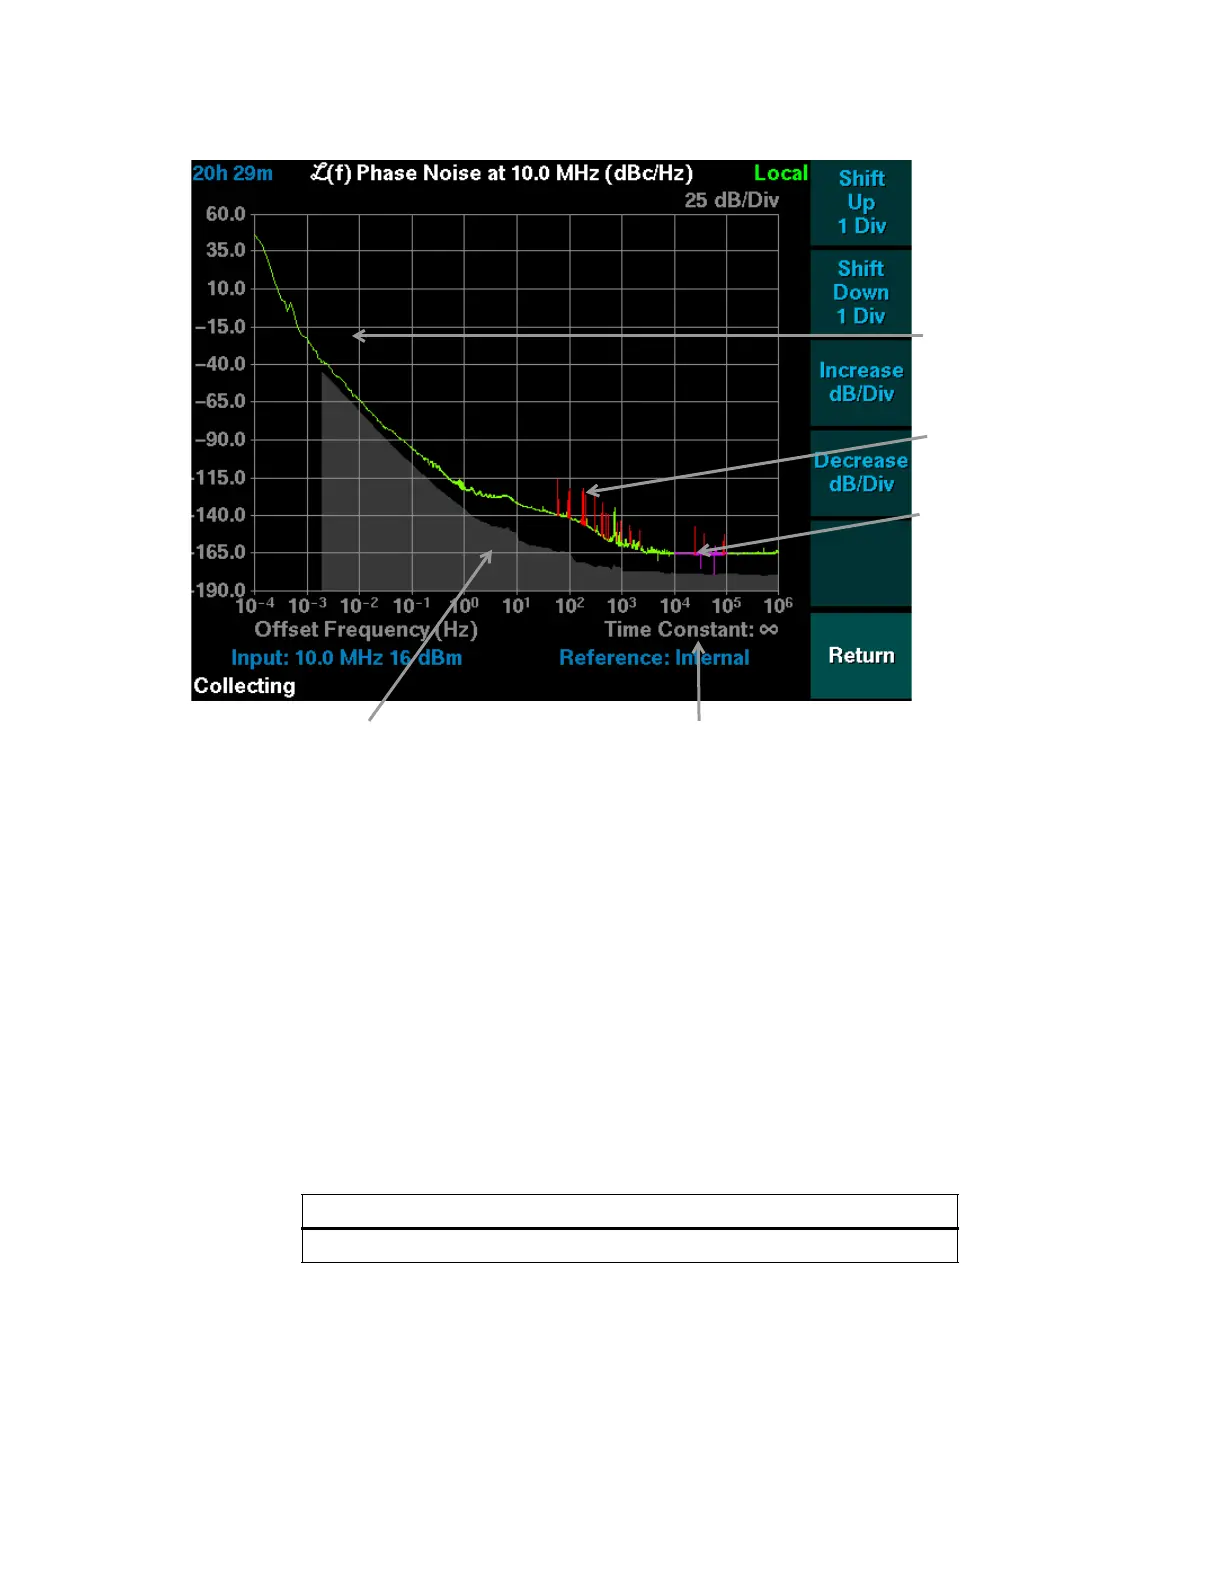
Figure 9: Example Phase Noise Plot
The lower portion of the graph is shaded to the level of instrument noise that produces an
imaginary result from cross-correlation. This noise is caused by the test system, and recedes over
long averaging times. Its level constitutes a lower bound on the measurement noise floor. The
noise components that produce real results from cross correlation are indistinguishable from phase
noise present on the input signals. A separate measurement of the instrument noise floor at the
power and frequency of interest is recommended.
Typically, the actual noise floor of the instrument is above this level outside the flicker region. In
the case where phase noise measurements are less than 10 dB above the measurement noise floor,
a correction factor can be subtracted from the Phase Noise measurement to provide a best estimate
of the phase noise of the signals. Table 2 lists the suggested correction factors:
The 5115A does not perform cross-correlation, and cannot shade the measurement noise floor
region.
Table 2: Magnitude Difference and Noise Correction Factor
Magnitude difference (dB) 161063210
Noise correction factor (dB) 0.1 0.4 1.2 1.8 2.1 2.5 3
New data display
in magenta.
Older data
display in green.
Spurs display in
red, even if part
of new data.
The region below the measurement
noise floor shaded gray.
Time constant shows the current
spectrum averaging interval.
 Loading...