48 5: Configuring Data Displays
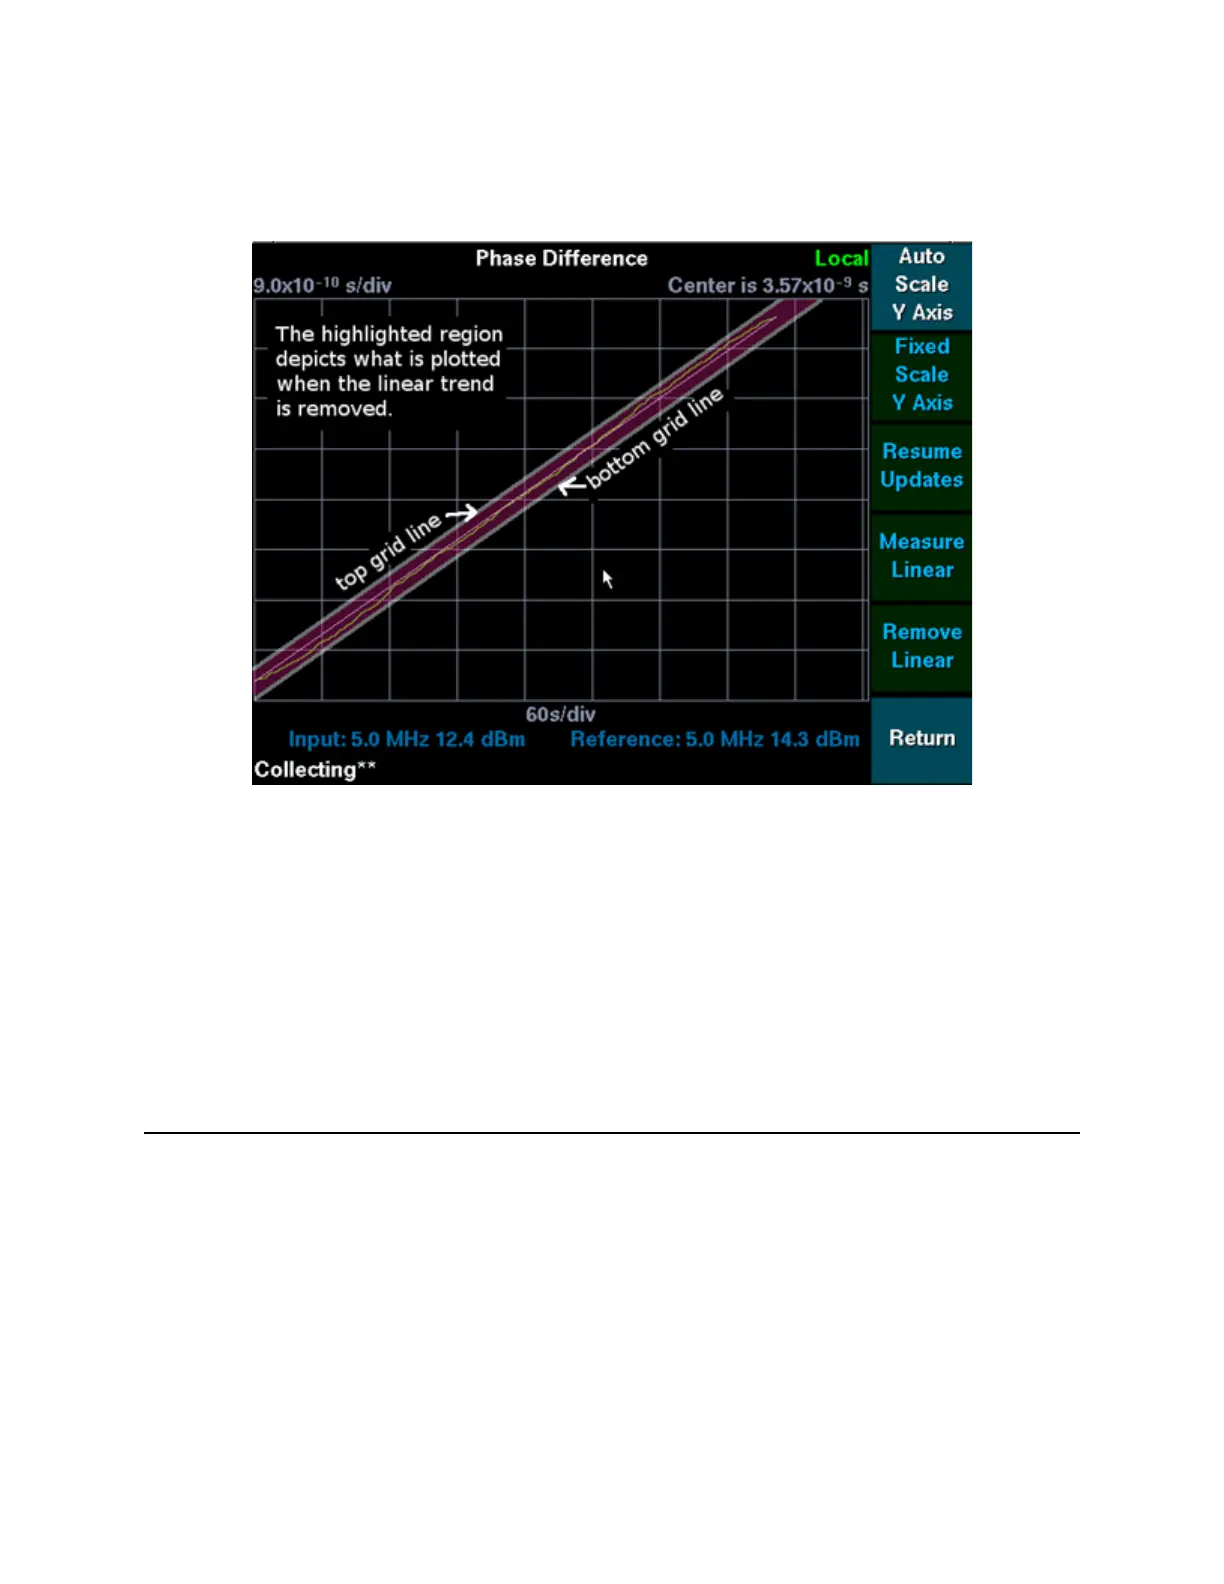
Linear Trend in Phase Difference Measurements, as depicted in Figure 15 Conceptual
Representation of Figure 14 Linear Trend Removed in terms of Figure 13 Linear Trend in Phase
Difference Measurements.:
Figure 15: Conceptual Representation of Figure 14 Linear Trend Removed in terms of Figure 13 Linear Trend in
Phase Difference Measurements.
5.3.3 Pausing or Resuming Updates
The phase difference measurement display can be paused by pressing the Pause Updates softkey.
To resume updates, press the Resume Updates softkey. As with all data sets that can be paused,
the test set continues to collect data while updates are paused and presents the latest data set when
they are resumed.
5.4 Configuring the Frequency Difference Plot
The PNTS can display the frequency difference between the Input and the Reference signals. The
measurements are plotted in real-time each second. All measurements are referenced to the Input
signal. After approximately nine minutes, data pans to the right so that new data becomes visible.
The frequency difference plot shows the following:
Value of the center line.
Value per division on the y axis.
Value per division of the x axis, in seconds. This cannot be changed.
 Loading...