46 5: Configuring Data Displays
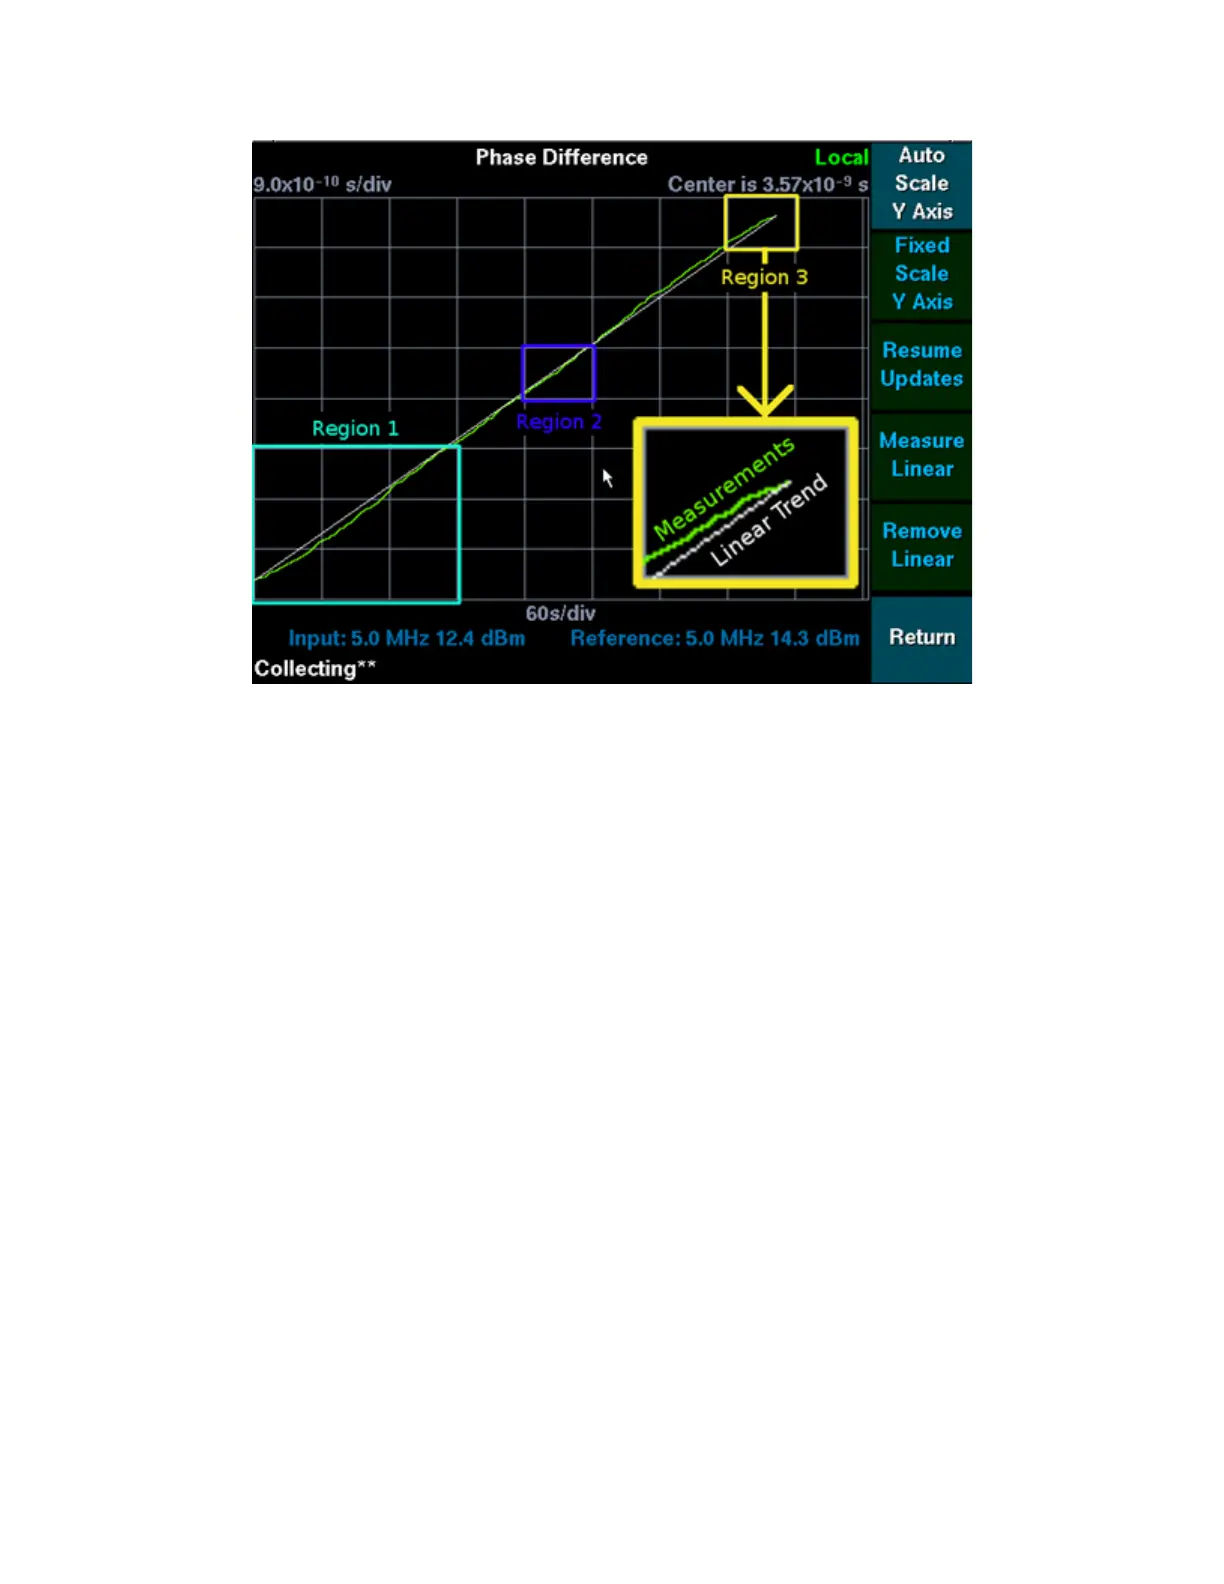
Figure 13: Linear Trend in Phase Difference Measurements
Make the following observations about Figure 13 Linear Trend in Phase Difference
Measurements:
Region 1 contains measurements which fall below the trend line, and reach the trend line
towards the end of the region.
Region 2 contains measurements near or on the trend line segment.
Region 3 holds measurements which approach the trend line segment from above.
Once the trend has been measured, it can be removed from the plotted measurements, by pressing
the Remove Linear softkey shown in Figure 13 Linear Trend in Phase Difference Measurements.
Removing the linear trend from this data set results in the display shown in Figure 14 Linear Trend
Removed:
 Loading...