5120A/5115A Operations and Maintenance Manual 47
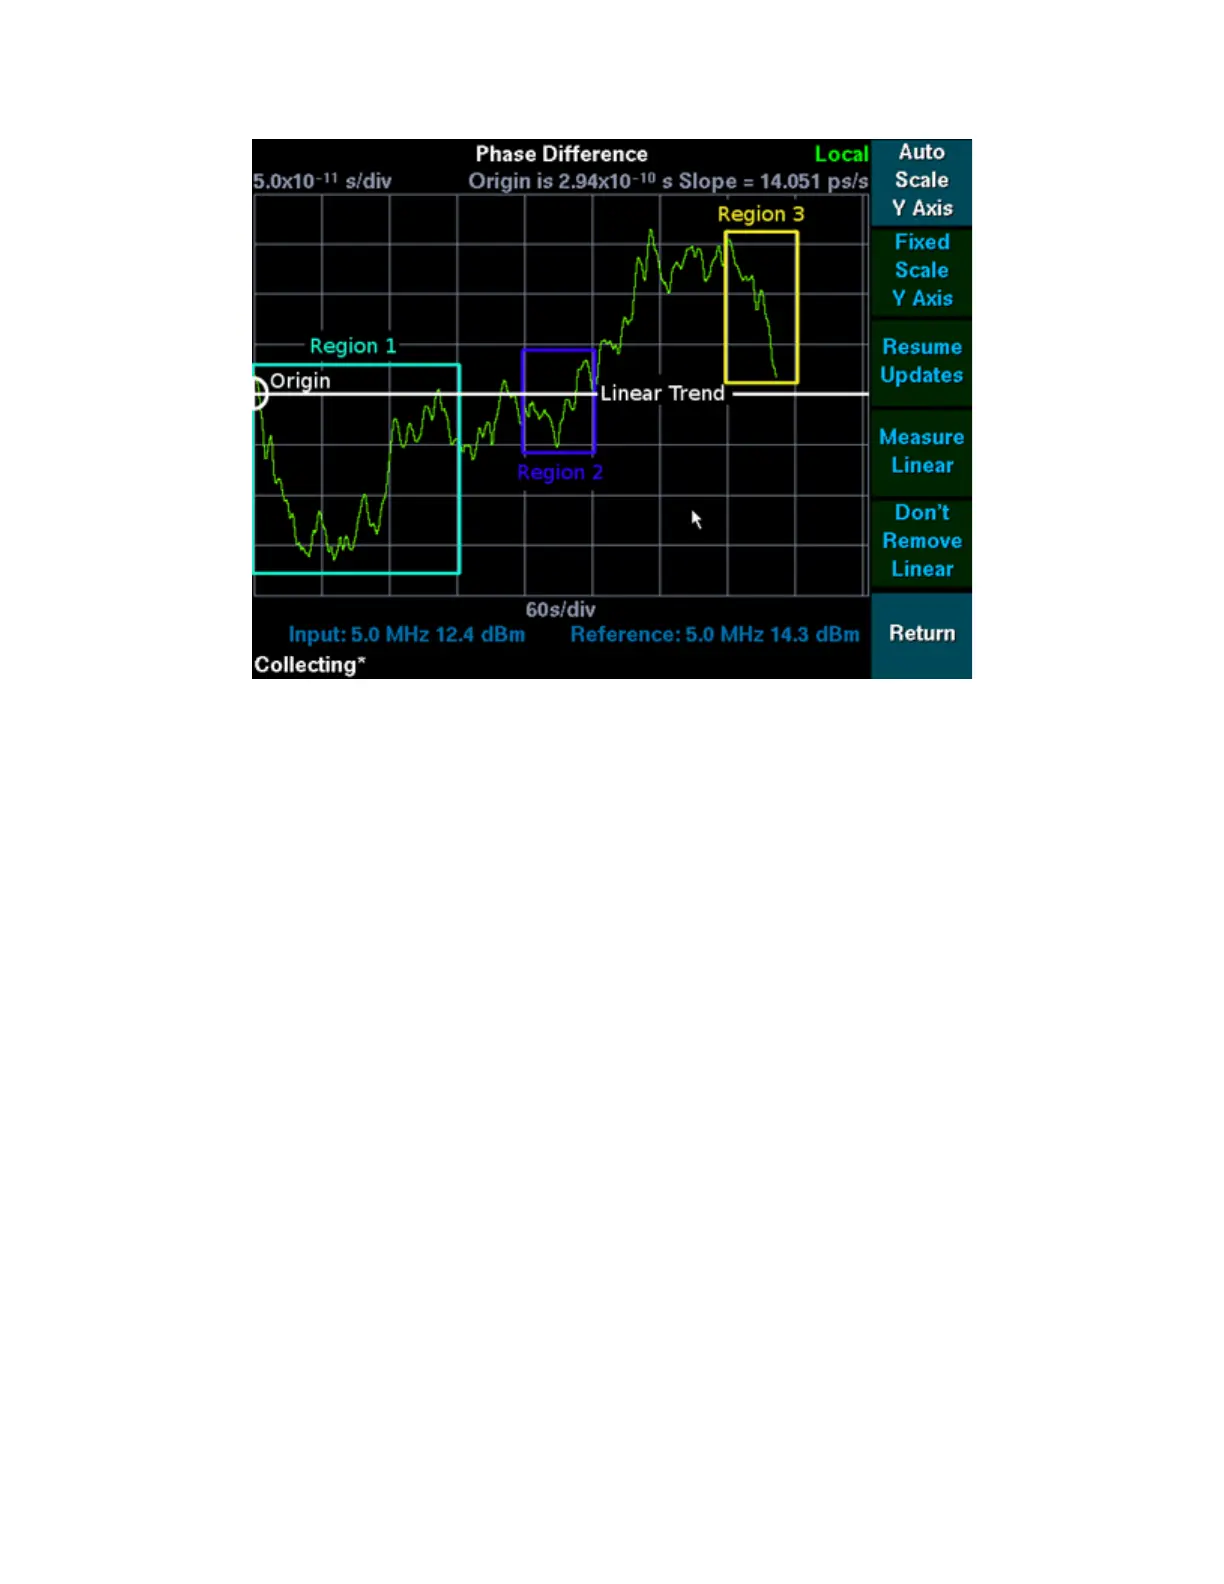
Figure 14: Linear Trend Removed
Make the following observations about Figure 14 Linear Trend Removed:
The y axis no longer lists the plot's center coordinate (in the top right corner) but refers to
Origin and the linear trend's Slope.
The origin is the center y-coordinate at the left most grid line.
Slope shows by how much the white line labeled Linear in Figure 14 Linear Trend
Removed was adjusted. It is the slope of the line through the oldest and most recent
measurement at the time the linear trend was measured using the Measure Linear
softkey.
Compare each of the rectangular regions with its counter part in Figure 13 Linear Trend in Phase
Difference Measurements.
The curves above and below the trend are better defined.
Trend line intersections which were barely noticeable in Figure 13 Linear Trend in Phase
Difference Measurements can readily be seen.
The Remove Linear softkey has changed to Don't Remove Linear. Pressing it at this time will
stop removing the trend from the data and display data set as seen in Figure 13 Linear Trend in
Phase Difference Measurements.
The linear trend can be measured whenever there are at least two phase difference measurements
available. Slope and origin are computed against the actual measurements even if the trend is
currently removed. There is no need to stop removing the trend before measuring it again.
If linear trend removal results in a plot that exhibits a linear trend of its own, the phase difference
measurements are following a curve rather than a line.
Pressing the Remove Linear softkey essentially plots the phase difference measurements' distance
from the trend last measured by the Measure Linear softkey. The top and bottom most grid lines
in Figure 14 Linear Trend Removed are parallel to the linear trend line segment in Figure 13
 Loading...