49
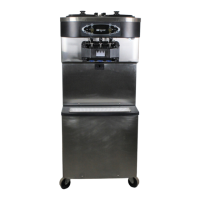
Model C606 Important: To the Operator
120515
The four temperature readings are recorded at the
same time on individual screens. Align the arrow
with the phase to be reviewed and select the
Calibration symbol
.
HEAT TREAT CYCLE
> HEAT phase temps
HOLD phase temps
SOAK phase temps
Figure 85
HEAT LH r1 s1
40.0 5/15 02:05
> Next zone
Exit
Figure 86
Line 1
Displays the Phase HEAT / HOLD /
SOAK / COOL
LH Left Hopper
r1 Record Number
s1 Sample Number
Line 2 Zone Temperature
Date & Time Temperature was recorded
Note: AnLoranHdisplayedtotheleftofthe
temperature reading indicates the temperature was
the lowest or highest recorded during the phase.
Selecting the Calibration symbol
will advance the
screen to the next zone. The second temperature
zone displayed is the left barrel (LB).
HEAT LB r1 s1
25.4 5/15 02:05
> Next zone
Exit
Figure 87
Select the Calibration symbol
to advance to the
next temperature zone; the right hopper (RH).
HEAT RH r1 s1
39.5 5/15 02:05
> Next zone
Exit
Figure 88
Select the Calibration symbol
to advance to the
last temperature zone in the recorded sample; the
right barrel (RB).
HEAT RB r1 s1
26.5 5/15 02:05
> Next sample
Exit
Figure 89
Select the Calibration symbol
again to advance
to the next sample. Each sample is displayed in 5
minute increments.
HEAT LH r1 s1
46.4 5/15 02:10
> Next zone
Exit
Figure 90
When the final sample in the phase is displayed, the
Heat Cycle results screen can be selected.
HEAT RB r1 s14
H 169.0 5/15
> Result
Exit
Figure 91