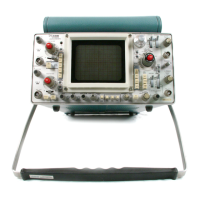
WAVEFORMS
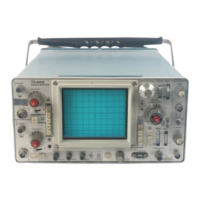
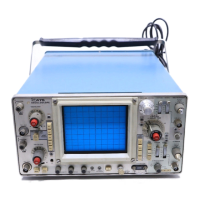
455/A2/B2
VOLTAGE CONDITIONS
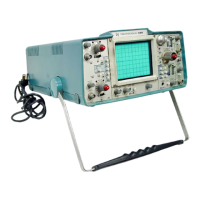
Voltages shown on this schematic diagram were measured with a Tektronix DM 501 Digital Multimeter. Voltage measurements can vary as
much as ±20%.
No signal was applied to the vertical input. The Main Module INTENSITY control was set to midrange. The B2 HORIZ DISPLAY was set
to midrange. The B2 HORIZ DISPLAY was set to A INTEN and the B SOURCE switch to NORM.
Upper voltages shown on the schematic diagram were measured with pin 13 of U2790 grounded.
WAVEFORM CONDITIONS
Waveforms below were taken from a Tektronix 7000-series oscilloscope equipped with readout, 7B series time-base, 7A13 Differential
Comparator and a 10X probe. The offset voltages were read directly from the 7A13 in the dc coupled mode. If a different test oscillo
scope system is used, the ac coupled mode may have to be used due to high dc offset voltages. This can cause some waveforms to appear
slightly different. Waveforms may vary as much as ±20%.
The Main Module calibrator signal was applied to the CH 1 vertical input through a compensated 10X probe. The Vertical Module CH 1
VOLTS/D IV switch was set to 5 mV. The test oscilloscope was triggered externally on the + slope from the (A) + GATE OUT connector
at the rear of the Main Module.
The B2 controls were set as follows:
HORIZ DISPLAY
A T IM E/D IV
B TIM E/D IV
A TRIG MODE
A SOURCE
B SOURCE
A and B COUPLING
DELAY TIM E POS
A and B LEVEL
A INTEN
50 ps
10 jus
AUTO
NORM
CH 1
DC
0.0
For stable display
^ _ __ __ __ __ __ _ ( D
_ ___ _____ __
® ^
1-'
p
m \
t _
50
Oju
S
5<30 m
V_
P
>oc
IM
S
5
00m
V
5
oc
M
5
—
5C rr V
j
>0(
M
s
—
200
mV
5CH
)P
$
— ■
1.1 v
+2.8 V
- T '
500
mV
p
oc
M
S
—
~
—
—
REV. C NOV 1977
1907-114
 Loading...