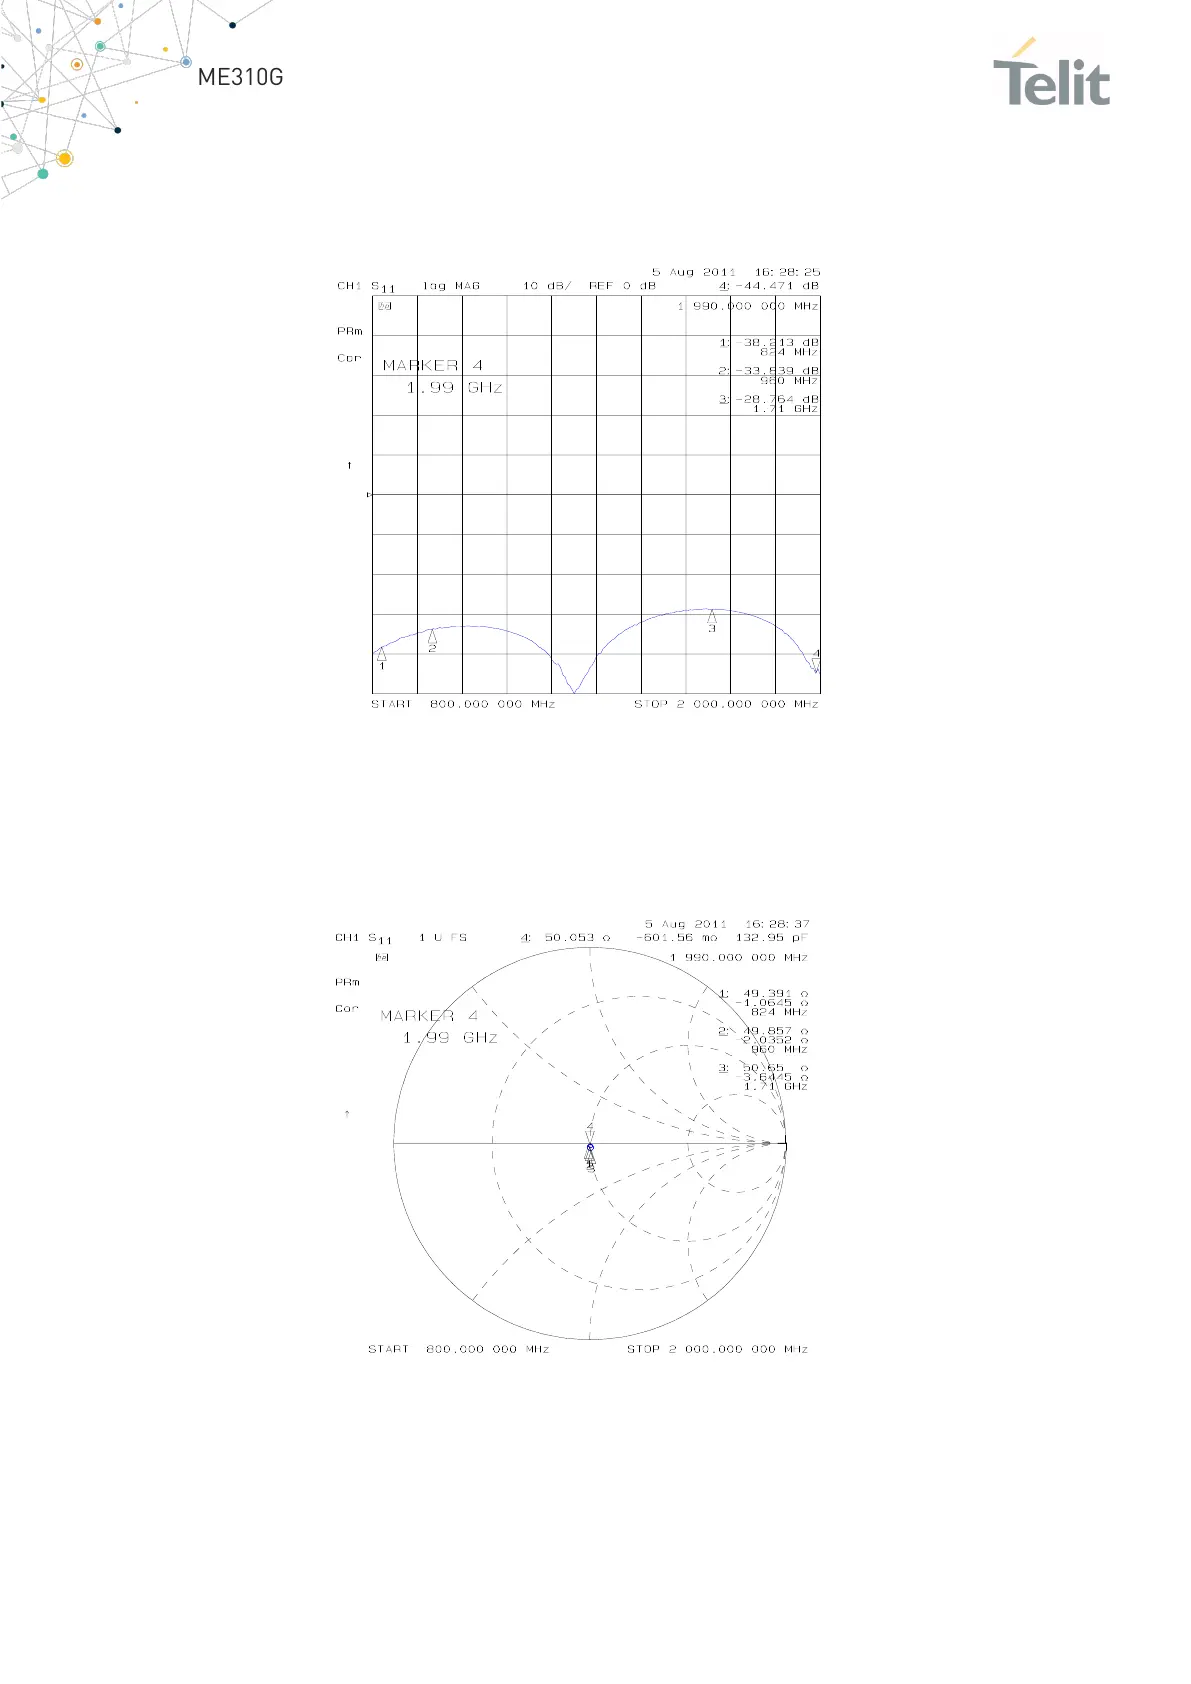
transmission line including the connector itself. During Return Loss / impedance
measurements, the transmission line has been terminated to 50 Ω load.
Return Loss plot of line under test is shown below:
Figure 13: Return Loss plot of line under test
Line input impedance (in Smith Chart format, once the line has been terminated to 50 Ω
load) is shown in the following figure:
Figure 14: Line input impedance
Insertion Loss of G-CPW line plus SMA connector is shown below:
 Loading...