RADIATION STATISTICS
Radioactive emission is a random process. The number of emissions
in a given time period is not constant but varies statistically about an
average value. The variation about the true mean value is a Poisson
distribution. In this distribution, the standard deviation (
σ
) about the
mean (n) is defined as:
σ
=
√
n
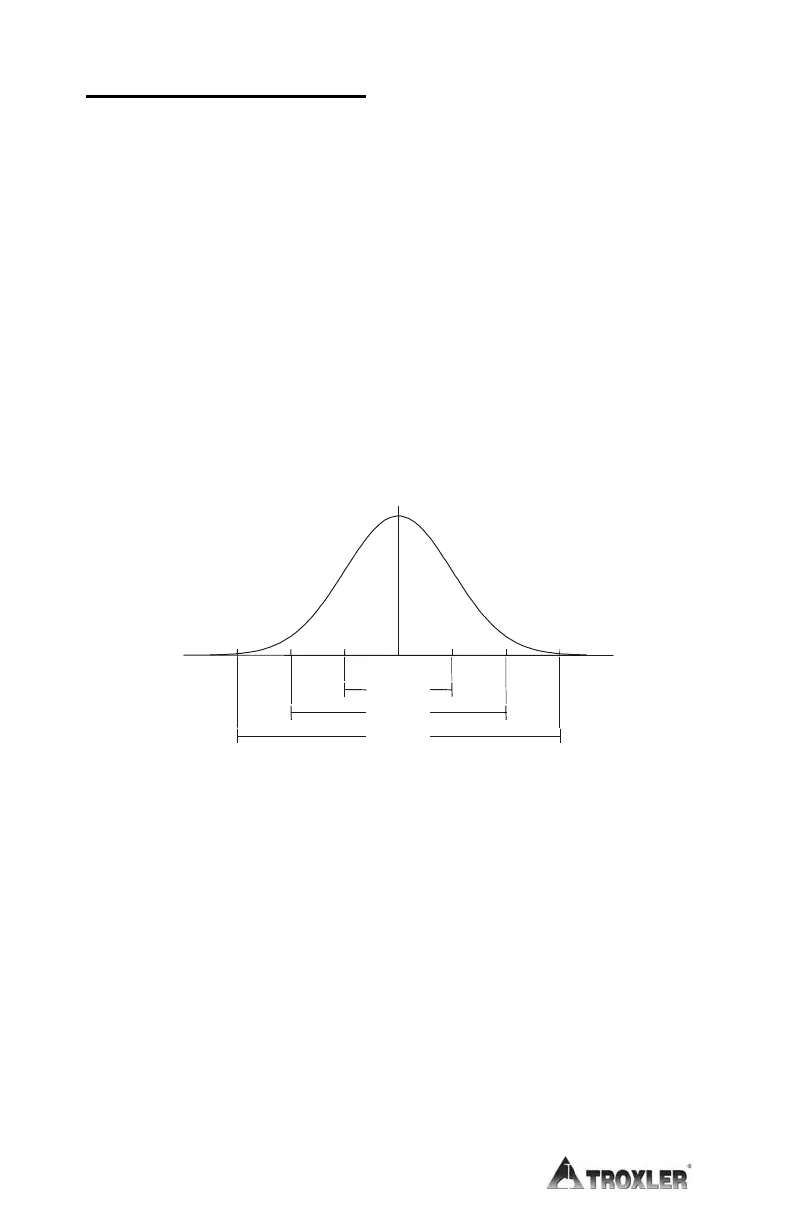
When the mean is greater than 100, the Poisson distribution can be
closely approximated by the normal distribution (Figure A-2). The
normal distribution predicts the probability that any given count rate
will fall within a selected region about the mean.
Normal Distribution
Figure A-2. Variation of Radioactive Emission
Using the average of a large number of counts to approximate the
true mean, the distribution shows that 68.3% of the time the count
rate obtained will be within ±1 standard deviation of the mean.
Figure A-2 shows the probability of counts falling within three
standard deviations of the mean. The operator may perform a
statistical stability test (stat test) to compare the experimental
standard deviation to the theoretical standard deviation (see
Chapter 5).
68.3%
95.4%