Chapter 4 ________________________________________________________________ Operation
VAISALA_______________________________________________________________________ 49
Pressure 3h Trend and Tendency
Reading
NOTE
The pressure tendency and trend readings are not available until
PTB330 has been powered up for at least three hours.
Using Basic Display
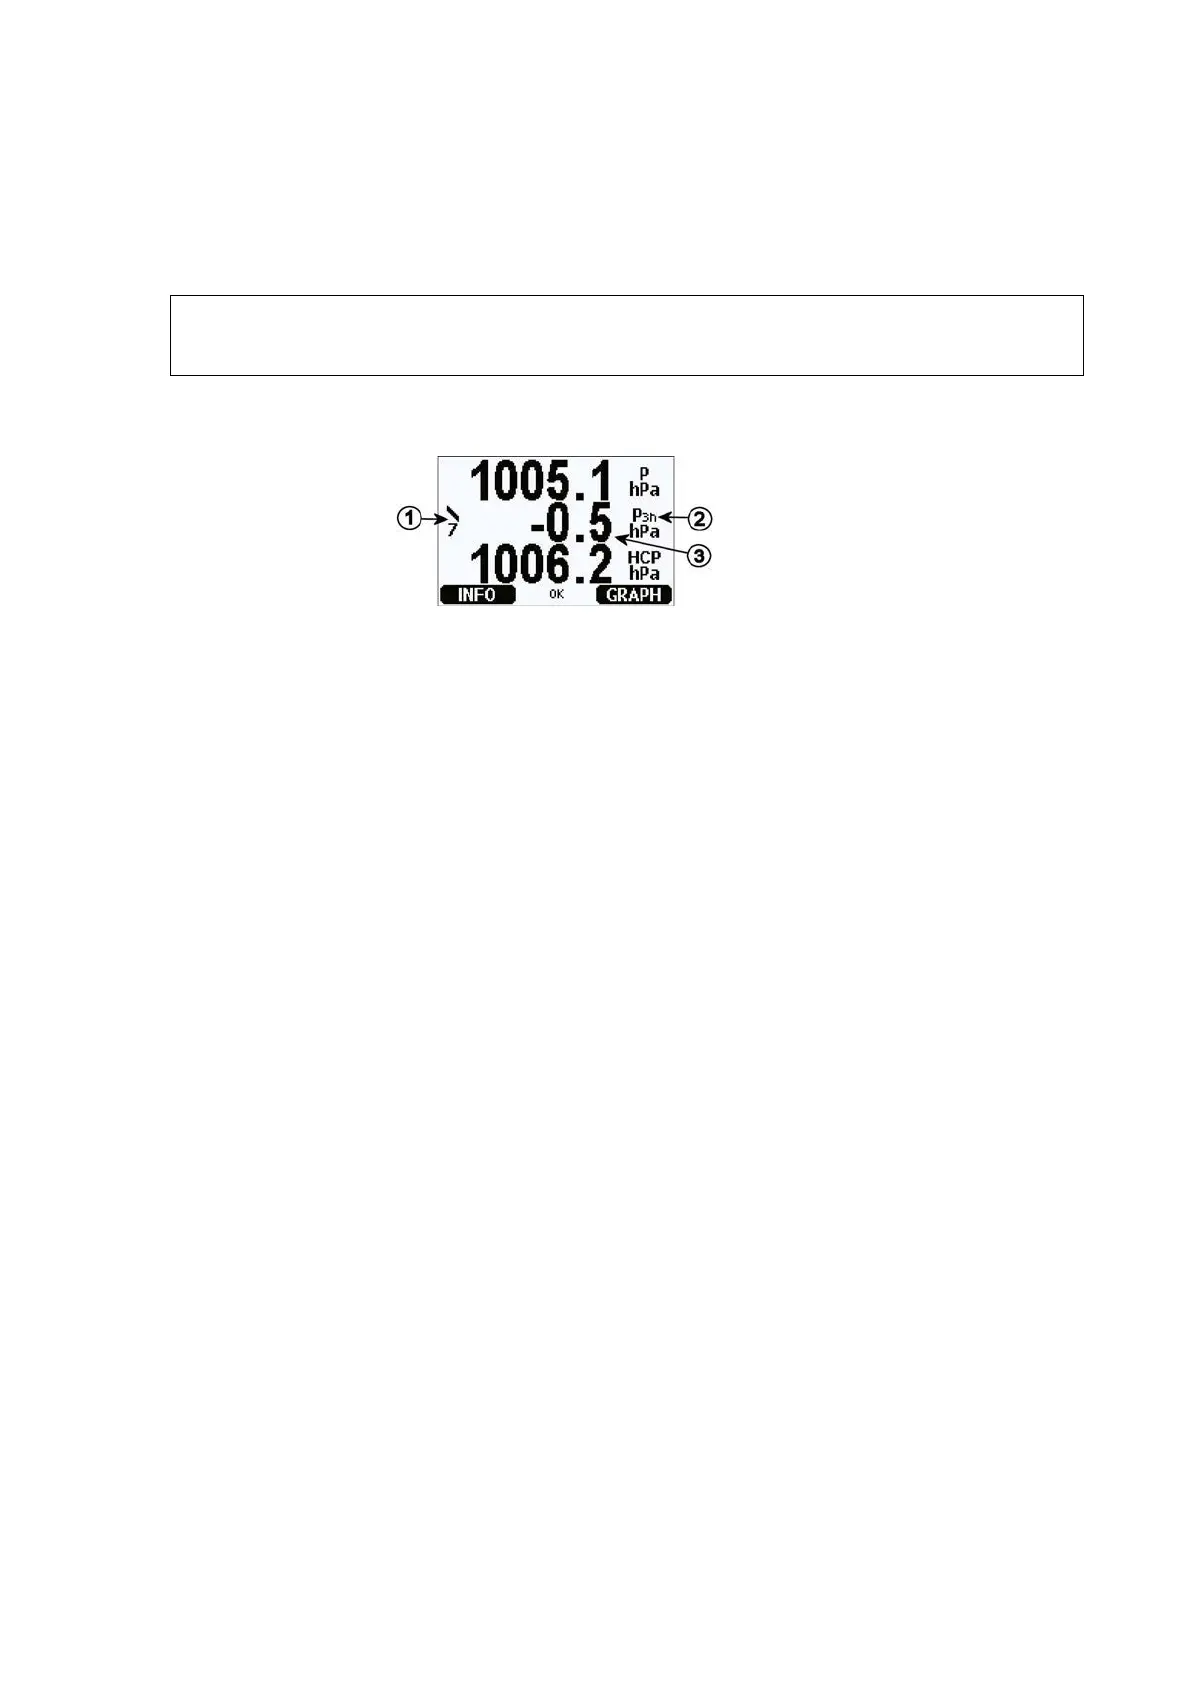
Figure 30 P
3H
Tendency
Numbers refer to Figure 30 above:
1 = Tendency: Increasing/decreasing graph sym
bol with the code
number (for more information, see Figure 31 on page 50).
2 = P3h symbol
3 = Trend (middlemost numeric value in the example),
that is, pressure change during last 3 hours
Pressure Tendency Graphics and Codes
The characteristic symbols of pressure tendency during the 3 hours
preceding the time of observation are described in Figure 31 on page
50.
 Loading...