USER'S GUIDE____________________________________________________________________
52 __________________________________________________________________ M210855EN-D
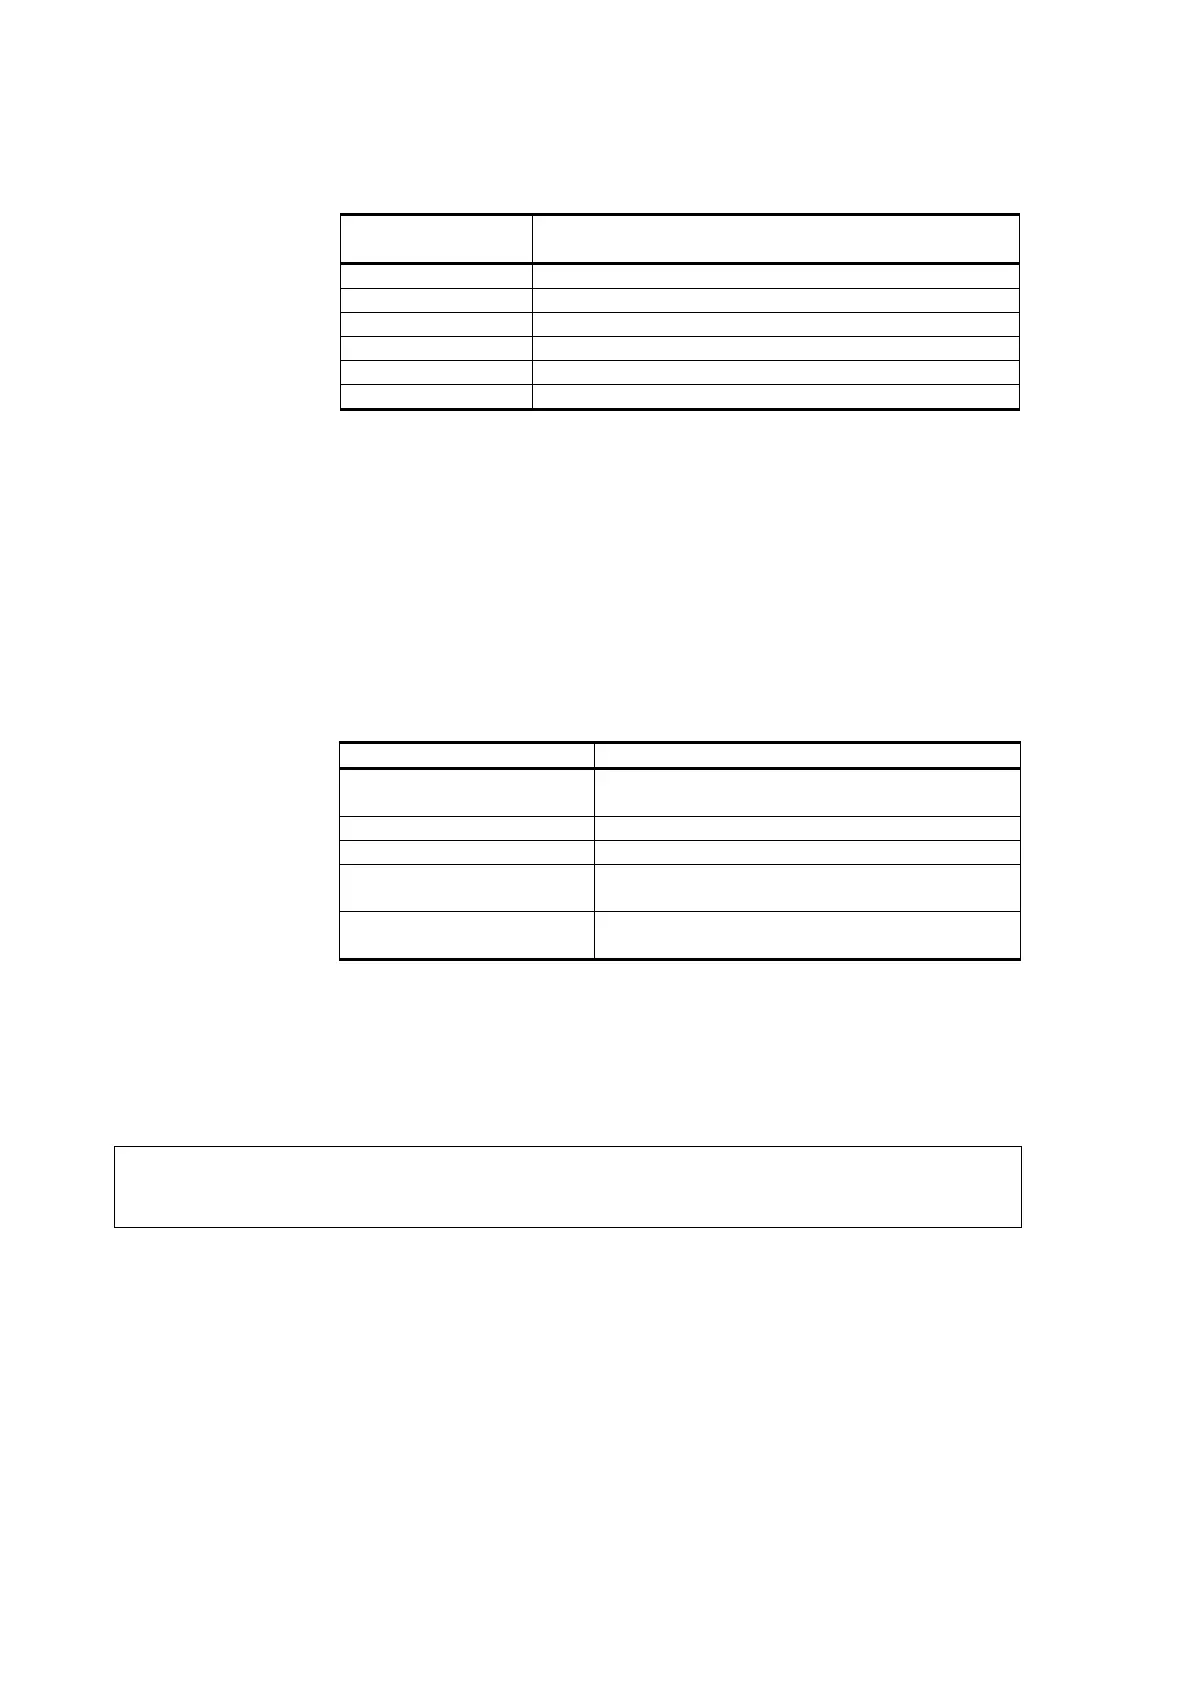
Table 8 Periods for Trend and Max/Min Calculations
Observation
Period
Period for Trend/Max/Min Calculations
(Resolution)
20 minutes 10 seconds
3 hours 90 seconds
1 day 12 minutes
10 days 2 hours
2 months 12 hours
1 year 3 days
- Press the up/down arrow buttons to zoom in and out the time in the
graph window.
- Press the left/right arrow buttons to monitor the cursor mode where
you can observe individual measuring points. Press an arrow button
to move the cursor (vertical bar) along the time axis. The numerical
value at the cursor position is shown at the left upper corner. Time
from the present to the chosen moment is shown at the upper right
corner.
Table 9 Graph Information Messages in Cursor Mode
Message Interpretation
Power outage Power failure (marked also with dashed
vertical line)
No data No data was recorded at pointed time.
Main unit failure Generic failure detected at pointed time.
Meas. failure Pressure measurement failure detected at
pointed time.
Adj. mode active The device was in the adjustment mode at
pointed time.
A question mark after time tells you that at least one power failure
(dashed vertical line) has occurred after the chosen moment. In this
case, the exact time difference between the present and the cursor
position is not exactly known.
NOTE
The 3h trend (P
3h
) is not shown on the graphical display. Instead, the
history readings of P (pressure) are displayed.
 Loading...