Using the Touch Screen
6 Vernier Software & Technology
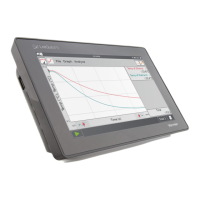
Table screen
—Use the Table screen to view a
tabular representation of your data, create
calculated columns, and manually enter data.
For a detailed description of how the Table screen
is used, see Manually Entering Data and
Analyzing Your Data.
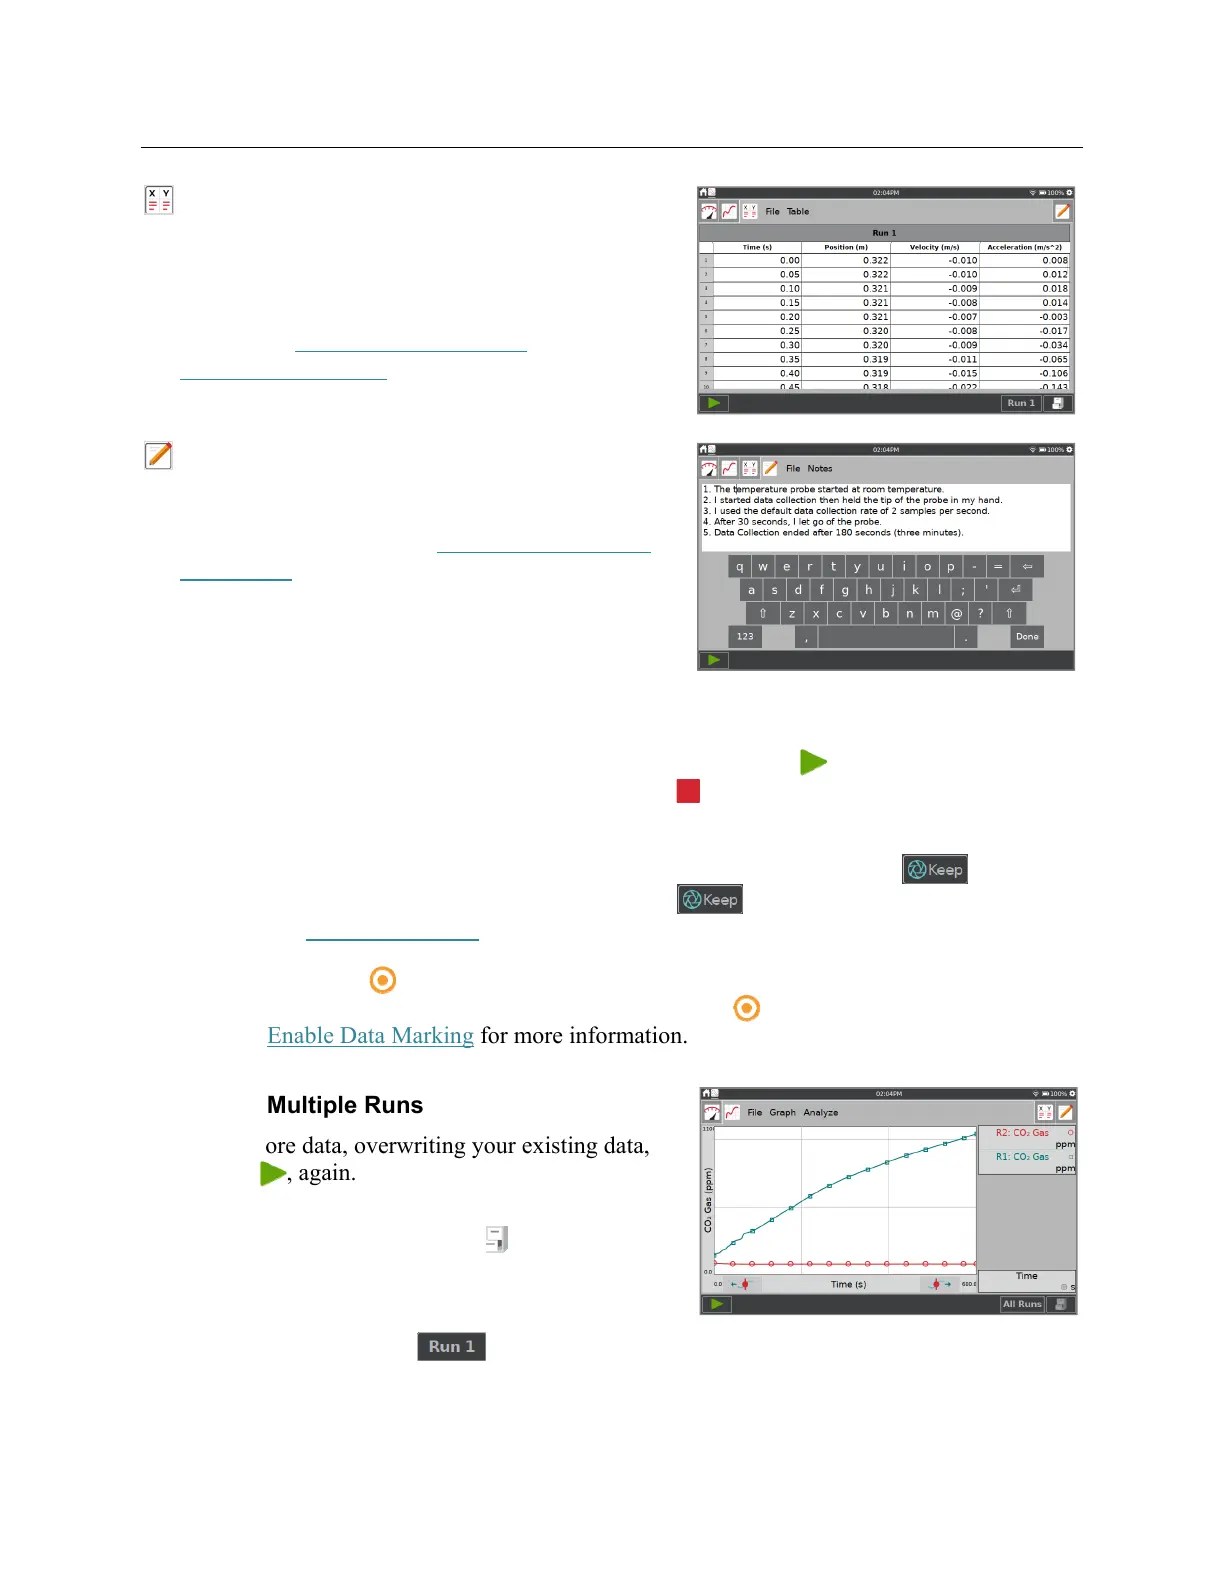
Notes screen
—From the Notes screen you can
record observations about your experiment.
For more information, see Adding Notes to Your
Experiment.
Data-Collection Controls
To start data collection from any LabQuest App screen, tap Collect, . As data are collected,
the graph and table are updated live. You can tap Stop, , to end data collection early or wait
until the collection completes.
In event-based data-collection modes (e.g., Events with Entry), a Keep button,
, appears to
the right of the Stop button. In this mode, you must tap to record the data point. For more
information, see Events with Entry.
The Data Mark button, , appears to the right of the stop button when the data mark option is
enabled for time-based collections. As data are collected, tap to mark a particular point of
interest. See Enable Data Marking
for more information.
Collecting Multiple Runs
To collect more data, overwriting your existing data,
tap Collect, , again.
To collect additional data without overwriting your
previous collection, tap Store Run, , before starting
a new data collection.
To display multiple runs of data on the same graph,
tap the run indicator button, , and select All
Runs.