LabQuest
®
3 User Manual
www.vernier.com/labq3 25
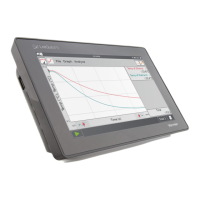
To zoom in on a selected region of data, touch and
drag across the screen to highlight a region. If needed,
you can adjust the trailing edge of the selected region
using the Examine Buttons ( , ).
Choose Zoom In from the Graph menu to scale the
x-axis to match the selected region. The y-axis
automatically scales to fit the data.
Choose Zoom Out from the Graph menu to undo a
Zoom In and return the graph axes to the previous
settings. If Zoom In is used several times, Zoom Out
will undo each Zoom In one at a time.
Drawing Predictions
The LabQuest App has a free-hand sketch tool for drawing on the Graph screen. This can be
used for a variety of purposes. It is most often used to sketch a prediction of how a graph will
appear once data are subsequently collected.
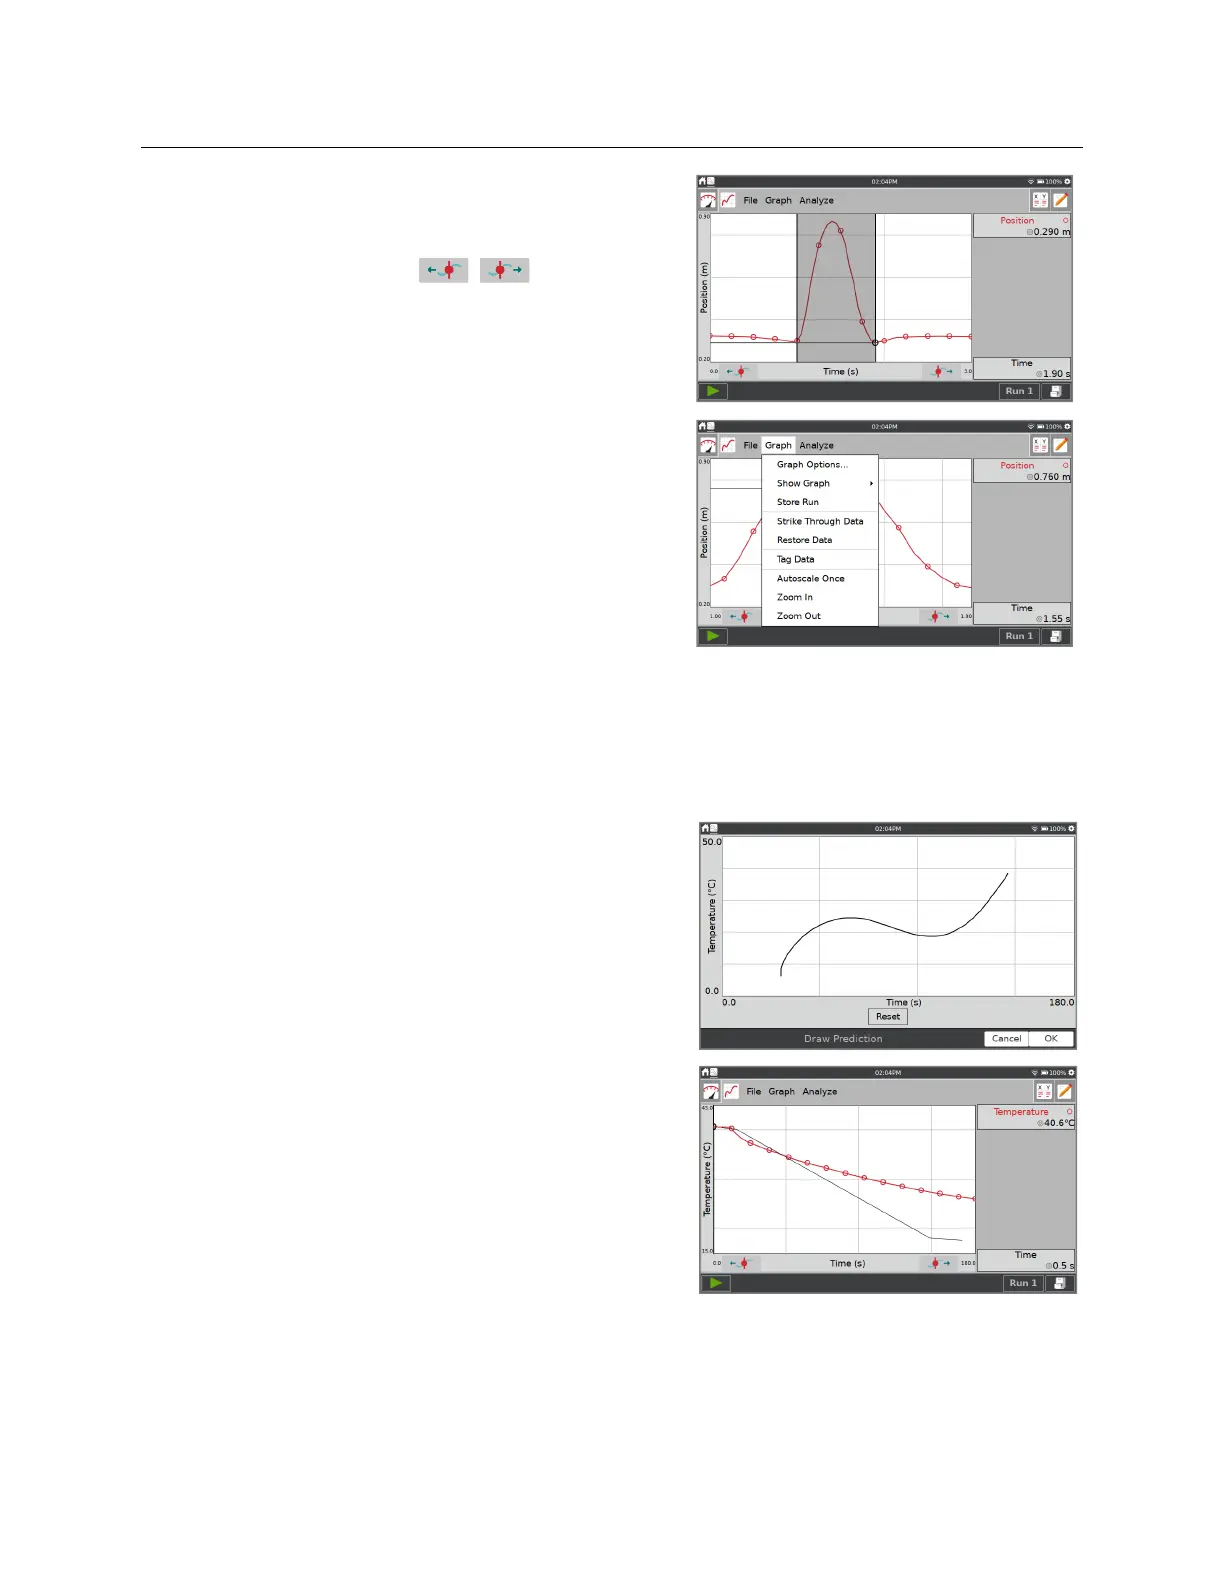
Choose Draw Prediction from the Analyze menu.
Select the desired graph (Graph 1 or Graph 2) to
activate the tool.
Touch-and-drag across the screen for smooth curves
or tap the screen in several places to connect
sequential taps with straight-line segments. The Reset
button removes your sketch if you need to start over.
Tap OK to place your sketch on the main graph. To
remove a prediction, choose Draw Prediction again
from the Analyze menu.
TIP! When collecting data, the data plot over the
prediction line.