Using the LabQuest
®
App
24 Vernier Software & Technology
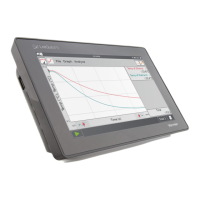
Autoscale Options
Choose Graph Options from the Graph menu to
modify the autoscale settings. There are three options.
Autoscale
—This is the default option and
functions as described above.
Autoscale from 0
—This is the same as the default
option except that the origin is always shown on
the graph.
Manual
—This scaling option respects the graph scaling you have chosen.
Manual Scaling the Graph using Gestures
Use a two-finger pinch/zoom/pan gesture to rescale the graph as desired. Rescaling the graph
during data collection is not recommended unless your Autoscale option is set to Manual. This
is because a new data point could force the graph to rescale to show that point.
Double-tap the graph to rescale the graph to fit the data.
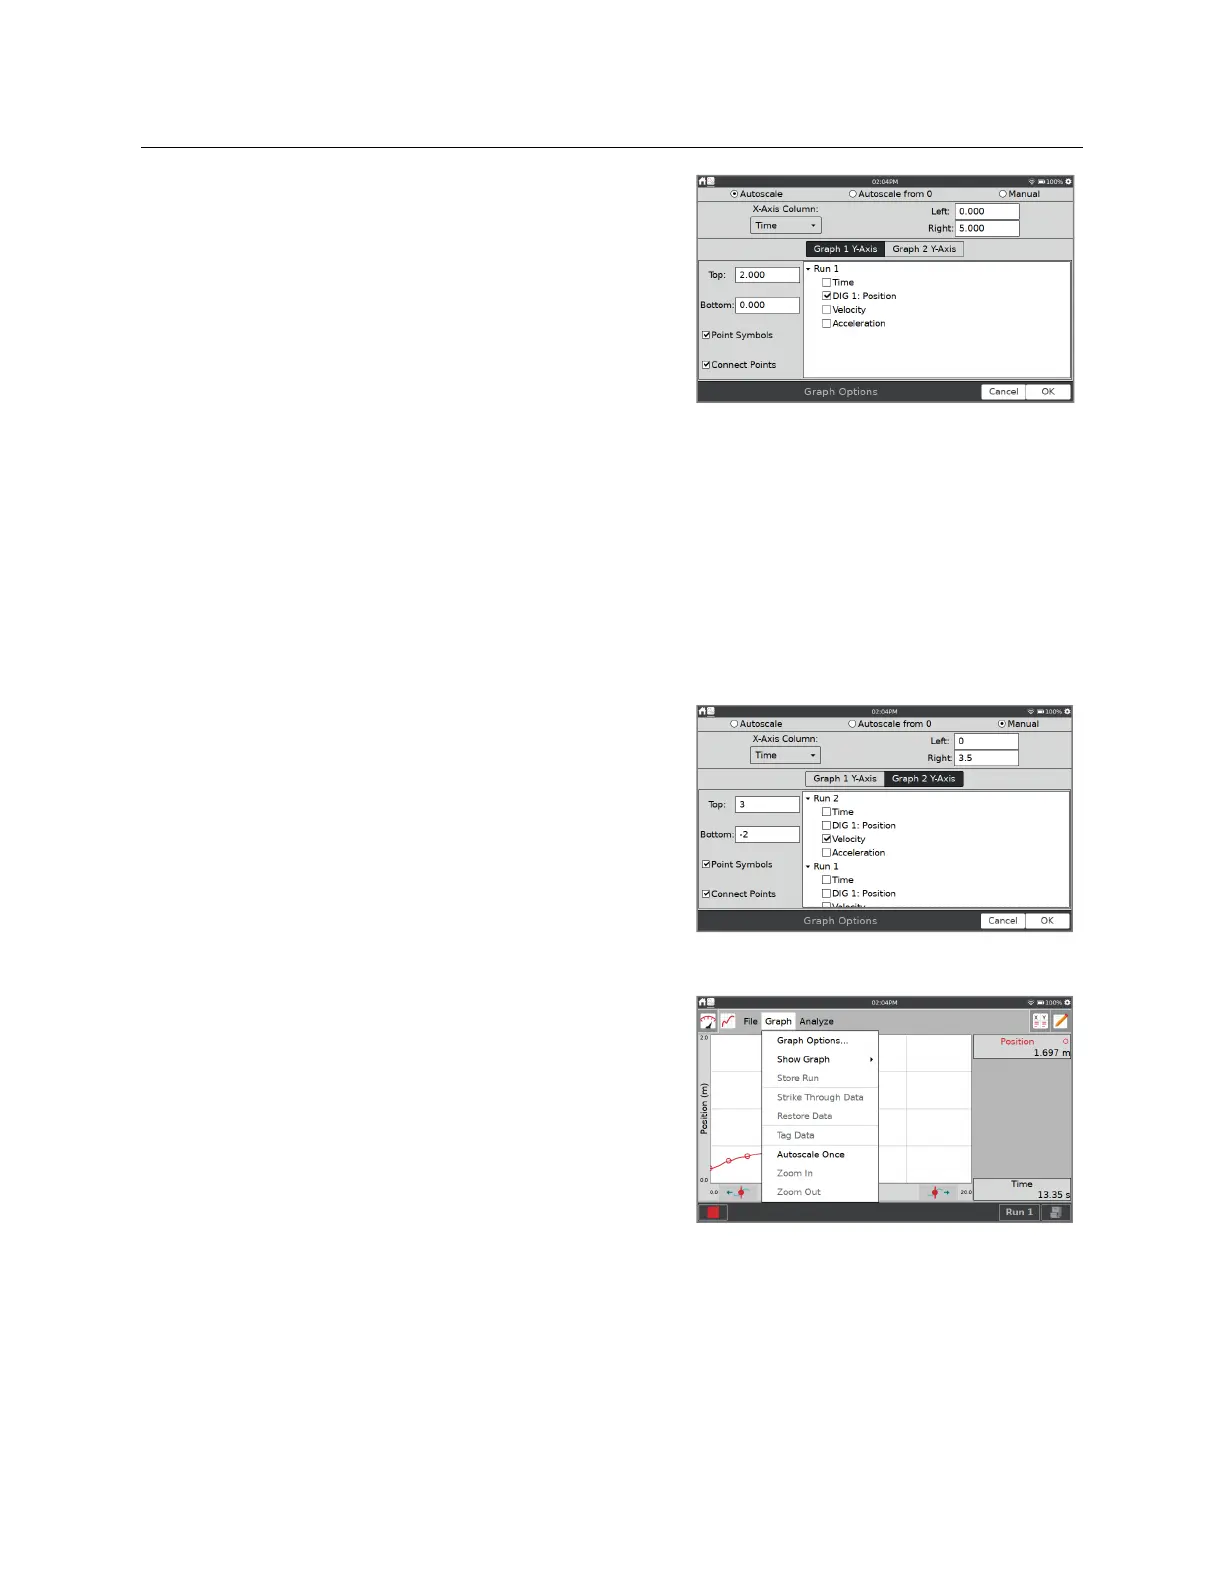
Manually Scaling the Graph Using Menus
Choose Graph Options from the Graph menu to
manually adjust the graph scaling.
Left
and
Right
—These change the x-axis range and
apply to both Graph 1 and Graph 2.
Top
and
Bottom
—These change the y-axis range.
There are separate entry boxes for Graph 1 and
Graph 2.
Choose Autoscale Once from the Graph menu to scale
the graph to the data. This is the same as double-
tapping the graph.
TIP! Be sure your autoscale option is set to Manual if
you want to retain your manual scaling during data
collection.