LabQuest
®
3 User Manual
www.vernier.com/labq3 11
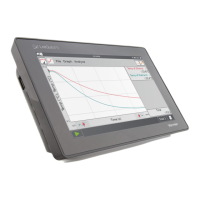
5. For data analysis, you can select to analyze all data
or just a portion of your data. To select a region of
data for analysis, touch-and-drag across the graph
to highlight the desired region.
Statistics
To view statistics for the selected data, choose
Statistics from the Analyze menu. Tap the check
box to select a data column.
The statistics information is then displayed in the
panel to the right of the graph.
To remove the displayed statistics, tap Analyze on
the Graph screen, choose Statistics, and then tap the
checked box to clear the selection.
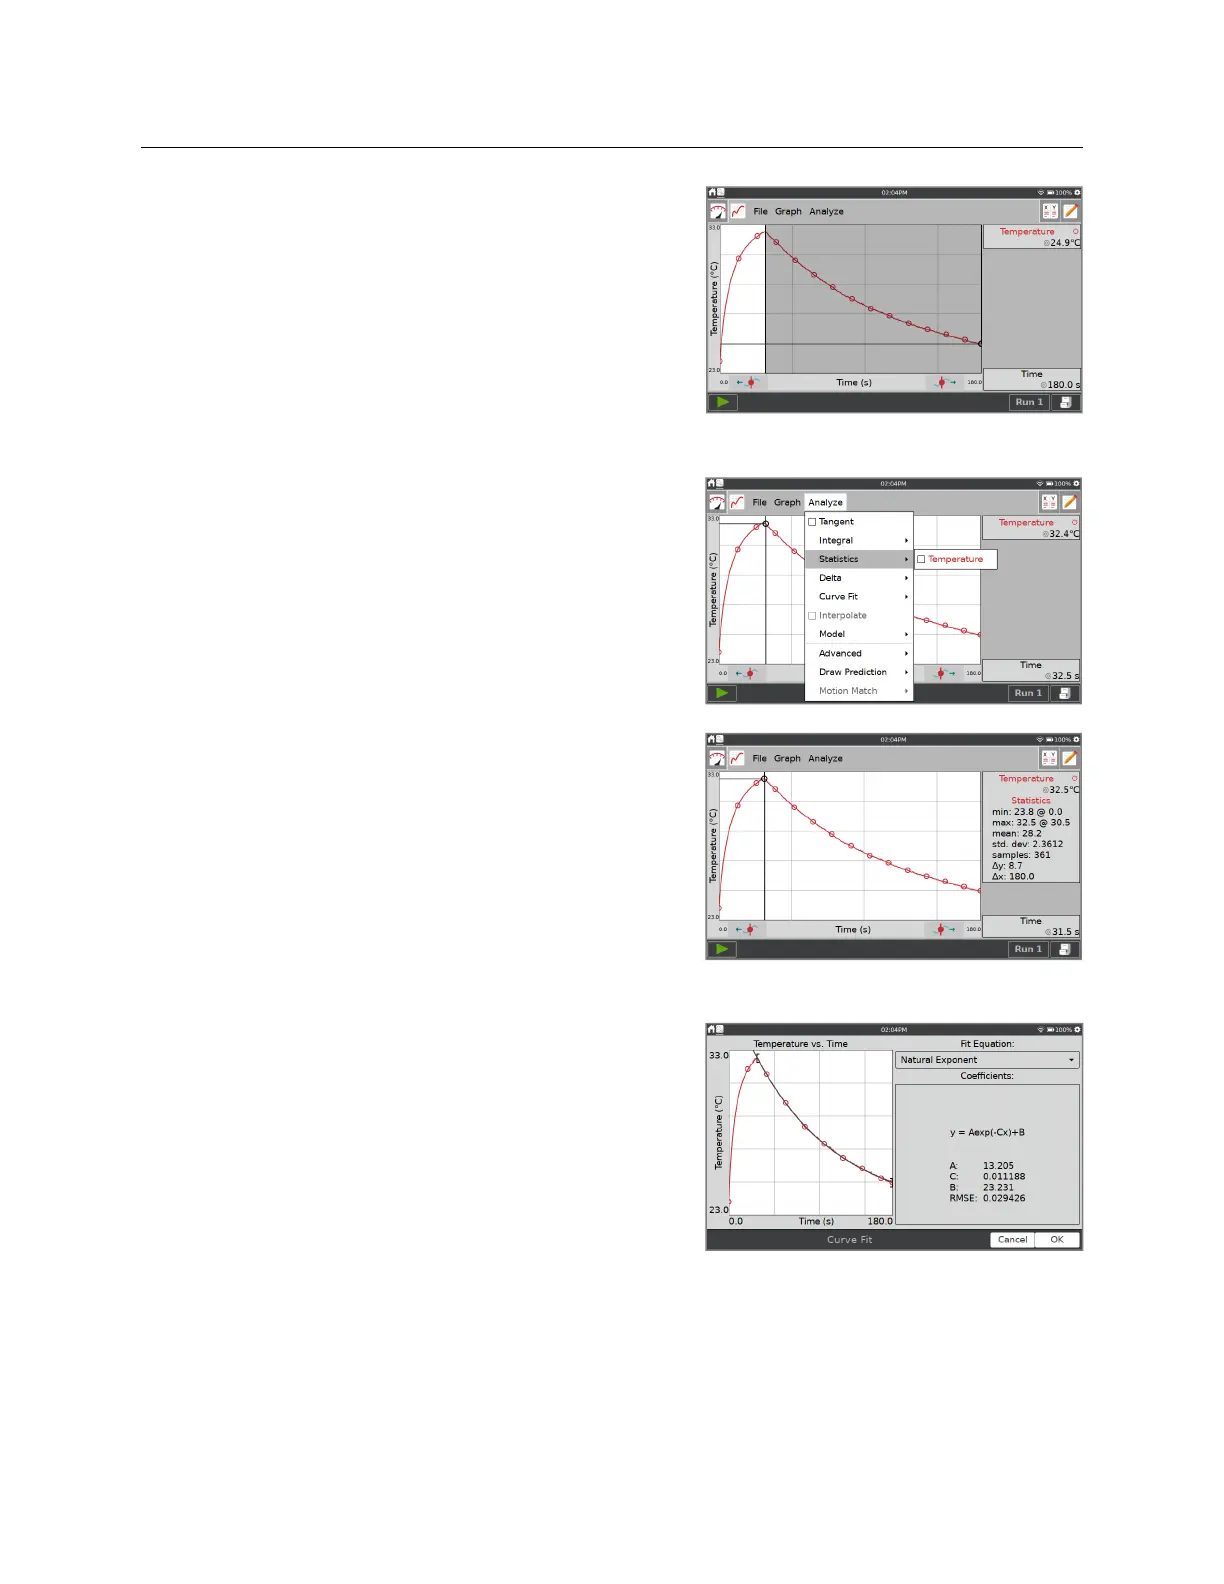
Curve Fit
To fit a curve to the selected data, choose Curve Fit
from the Analyze menu. Tap the check box to
select a data column (the Linear fit is shown by
default). Tap the Fit Equation dropdown and
choose the desired equation.
LabQuest automatically determines and displays
the fit coefficients and displays a preview of the
curve fit on the graph. Tap OK to apply the fit and
return to the Graph screen.
To remove the fit, choose Curve Fit from the Analyze Menu, and then select the checked box
to clear the selection.