Using the LabQuest
®
App
32 Vernier Software & Technology
The data are shown in the table as struck. This is what
gives the tool its name.
To restore all struck data, choose Restore Data from
either the Graph or Table menu.
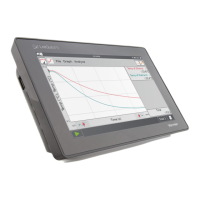
Delta
The Delta tool opens a preview graph where you can examine x- and y-deltas over regions of
your data.
From the Graph screen, choose Delta from the
Analyze menu. Touch-and-drag across the graph to
create a box overlaid on the graph. The vertical side of
the box yields y, and the horizontal side of the box
yields x.
To redo the selection, touch-and-drag again.
Tap OK to keep these values and display the box on
the graph. To exit the Delta tool without displaying
the box on the Graph screen, tap Cancel.
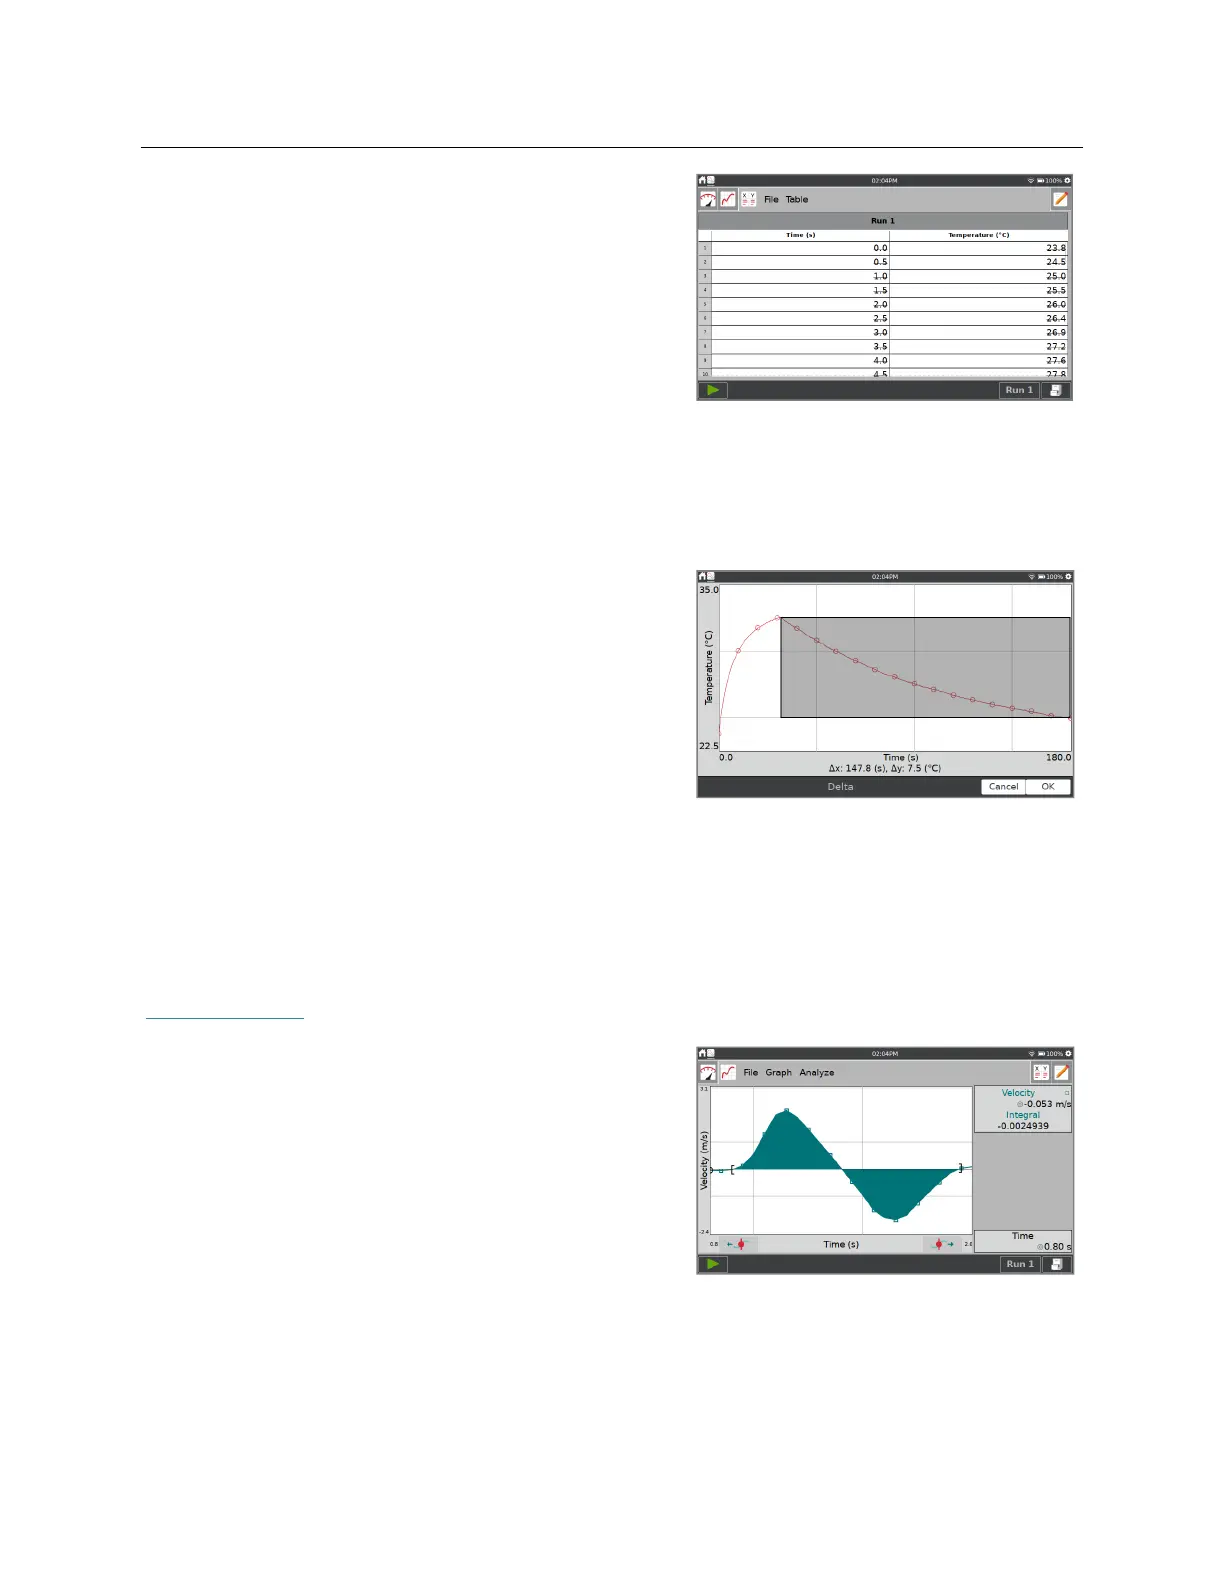
Integral
The Integral tool numerically integrates graphed data. If a region of the graph is selected, only
that region is used for the integral. If there is no selection, the entire graph is used. See also
Peak Integration
.
From the Graph screen, choose Integral from the
Analyze menu. Enable the tool by tapping on the
displayed sensor or column name.
The area representing the integral is shaded and the
numeric result is displayed in the panel to the right of
the graph.