Customer Service 800-496-9430 | www.zaon.aero
UNDERSTANDING PCAS26
5>If additional aircraft are within detection range, the above process is repeated for each aircraft. The top
threat is displayed on the left of the traffic screen, and on Screen A, the second and third aircraft are
displayed on the right.
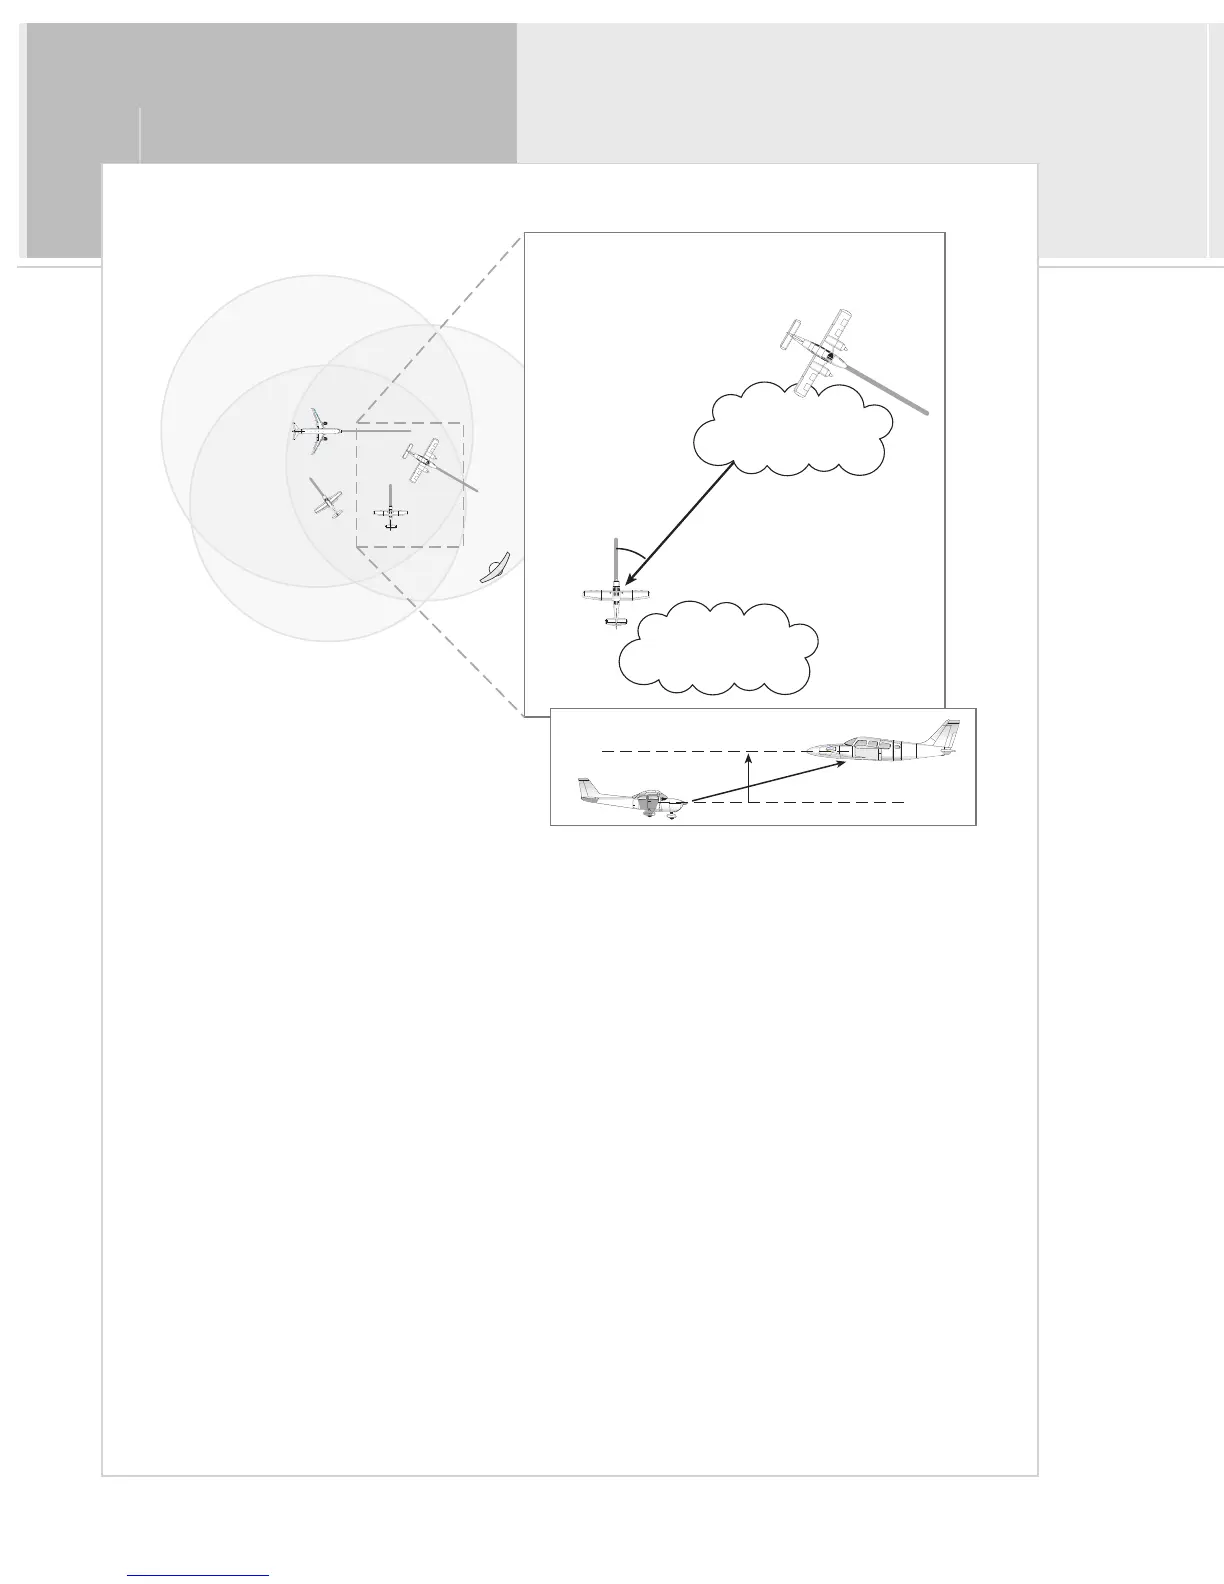
The greatest threat is determined by looking at aircraft within the detection window you set up and
comparing primarily the vertical separation (± relative altitude), and secondarily the range to the aircraft
currently being displayed. PCAS uses proprietary algorithms to determine which of two or more aircraft
is a greater threat. See flight scenarios later in this chapter for more information.
Example Flight Scenarios
Many different flight scenarios exist, of course, but you will find common situations that prevail in everyday flight. The
examples on the following pages illustrate what to expect in these common situations and how to visualize the aircraft
around you.
 Loading...