77
During the process of ECG signal acquisition, if waveforms become cluttered
or unstable, please refer to chapter 8.
6.2.2 ECG Report
The following are the reports printed in real-time auto-simultaneous mode:
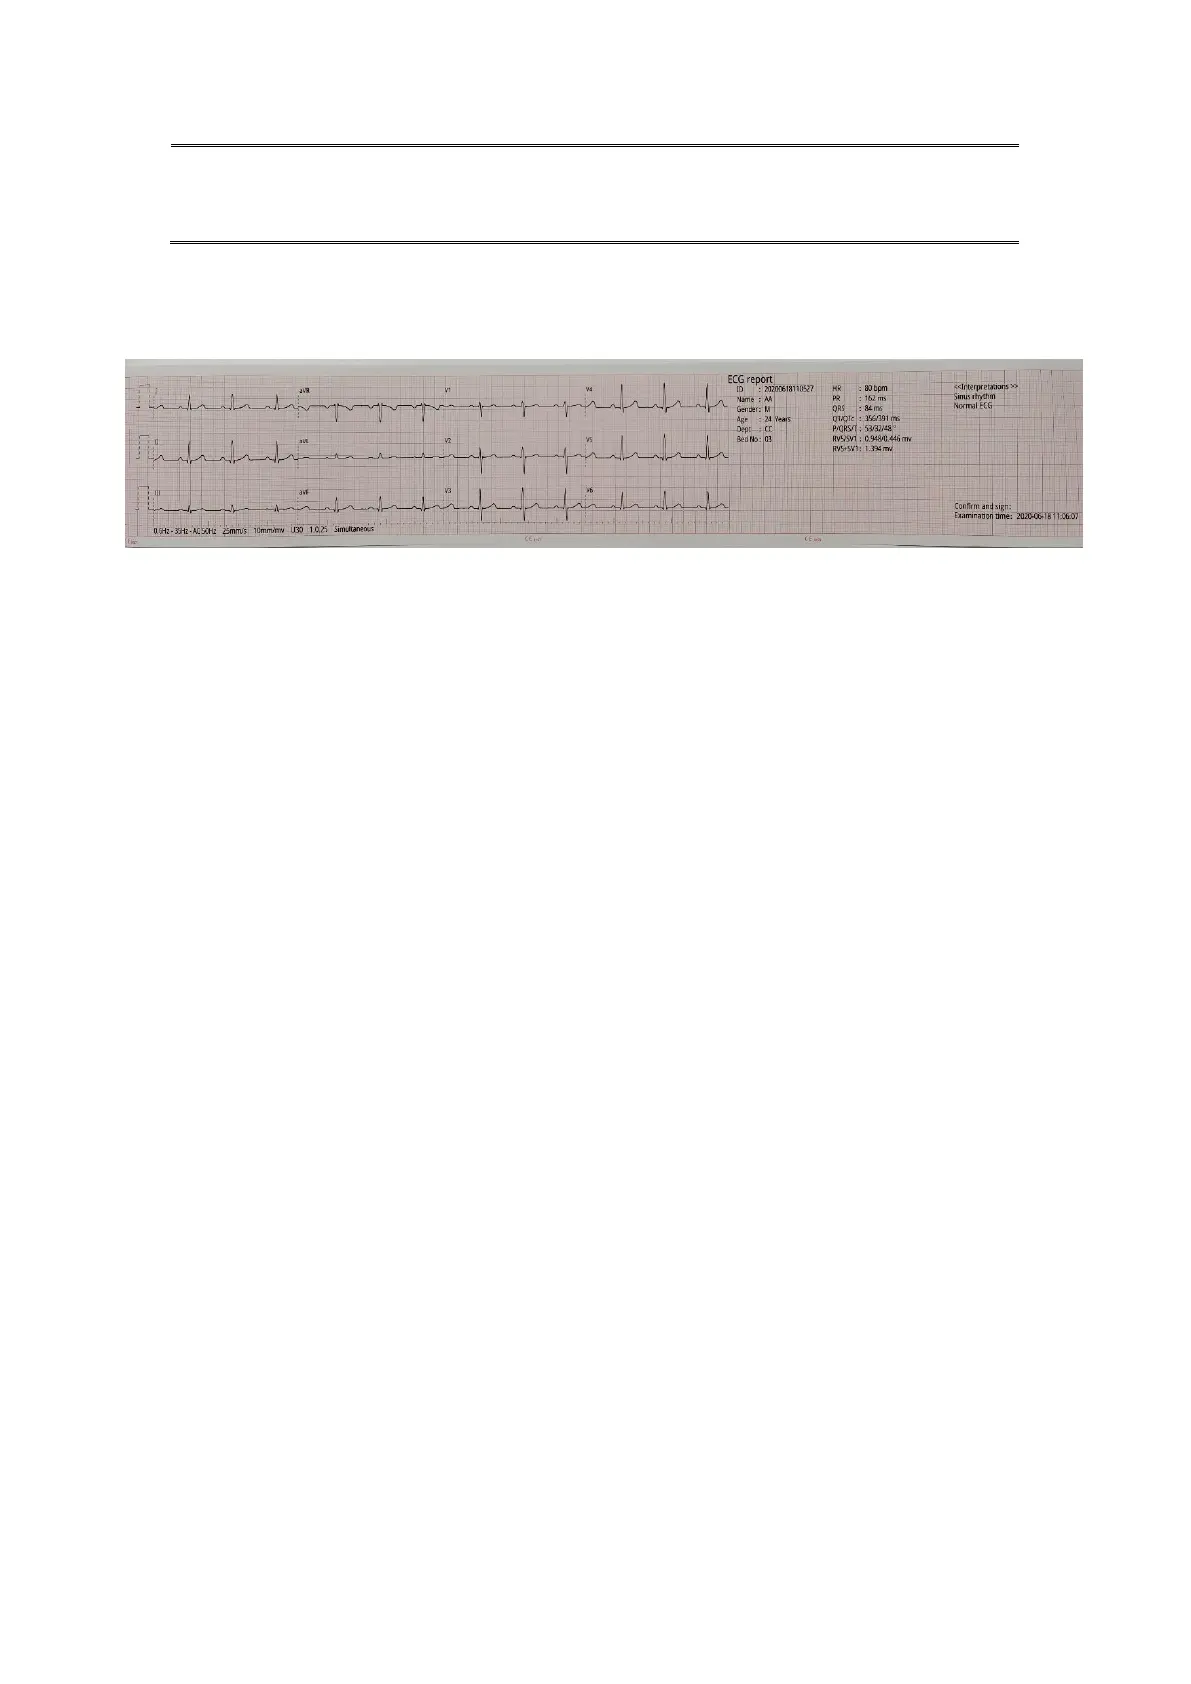
Fig. 6.1 ECG Report
This ECG report contains the following information:
The ECG waveform 3×4 layout, patient information, date of inspection, and measurement
information.
Measurement information:
HR: heart rate
P duration: average value of the P-wave duration of the average heartbeat of each lead
PR interval: average value of the PR interval of the average heartbeat of each lead
QRS duration: average value of the QRS duration of the average heartbeat of each lead
QT/QTc interval: average/normalized value of the QT interval of the average heart beat per lead
of each lead
P/QRS/T electric axis: the dominant direction of the average integrated ECG vector on the
frontal plane.
RV5/SV1 amplitude: the maximum amplitude of the R and R' waves in the average heart beat
on the lead V5 / The maximum value of the absolute amplitude of the S and S' waves in the
average heart beat on the lead V1
RV5+SV1 amplitude: RV5 and SV1 sum
Minnesota code (optional) ECG code
Diagnostic results: the diagnostic results show the results of the automated diagnosis.
Top information; name of medical institution
Bottom information: 0.6~35Hz (0.6Hz baseline drift filter, 35Hz low pass filter)