17
5.2.
Display
Note
To get accurate diagnosis, take care to accurately read the data
displayed on the recorder and interpret it properly.
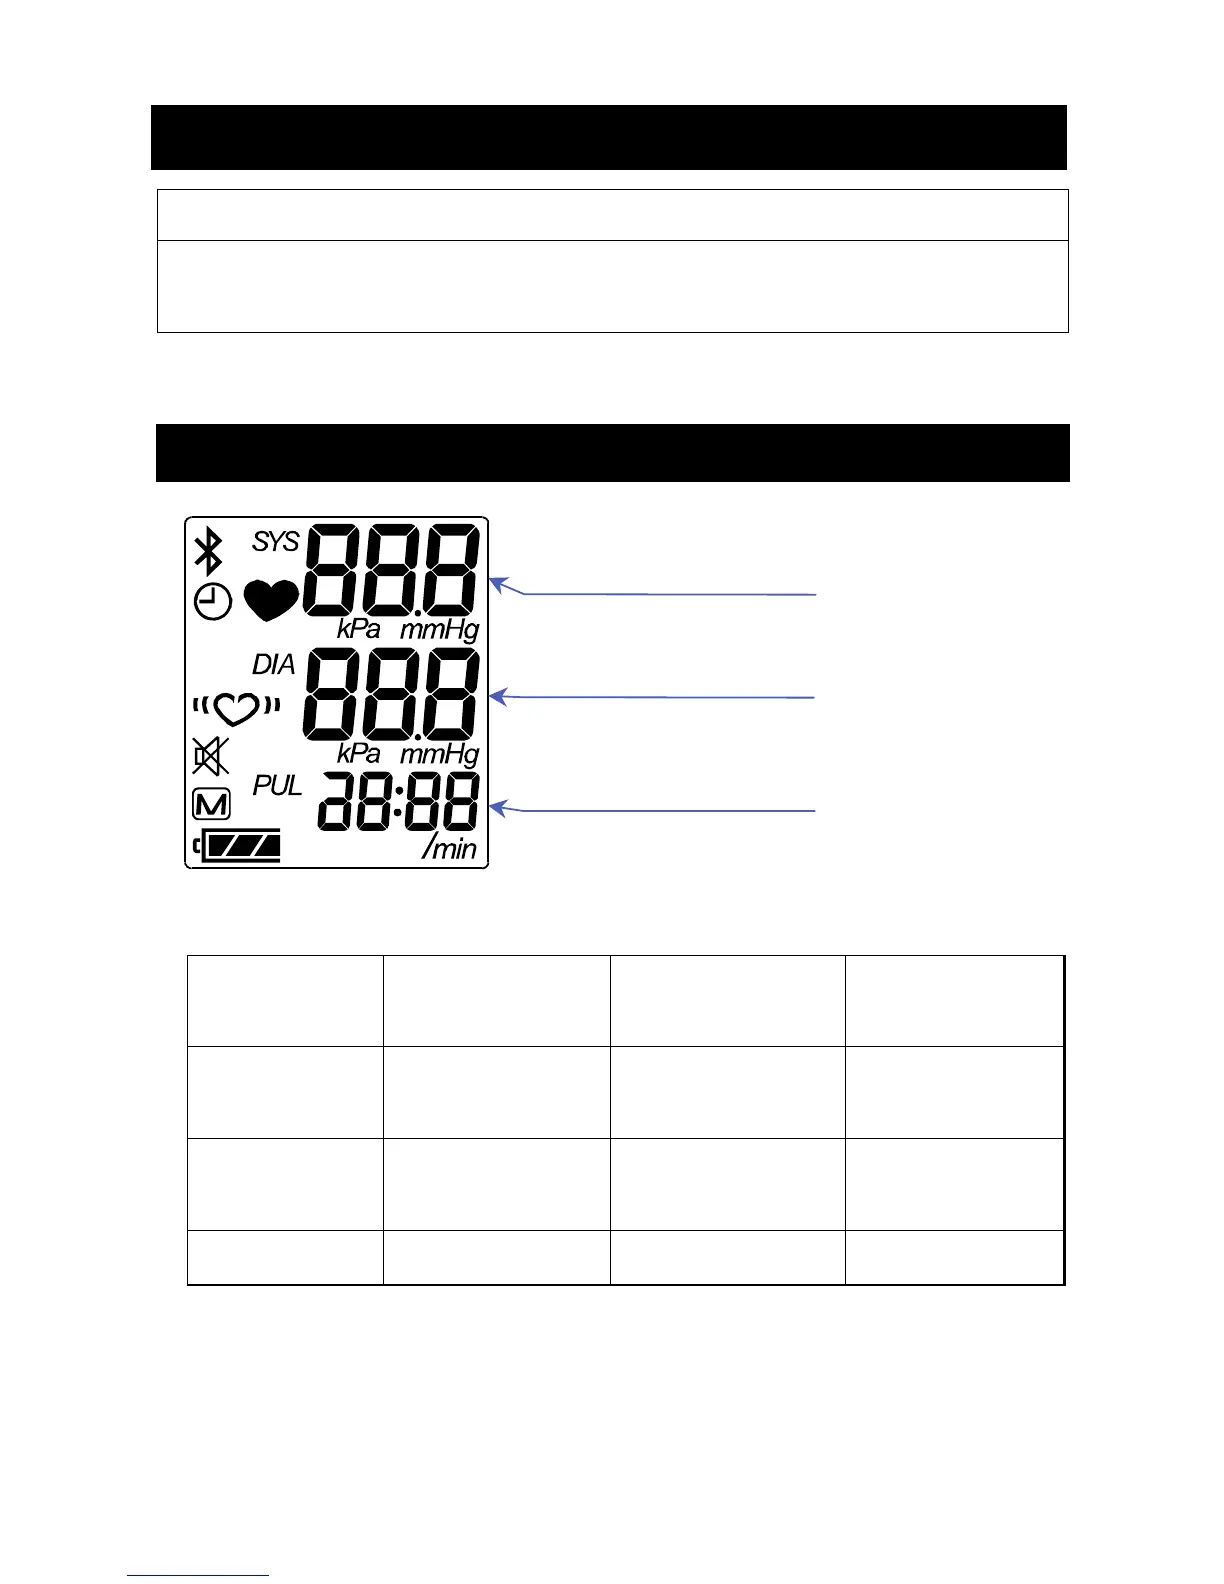
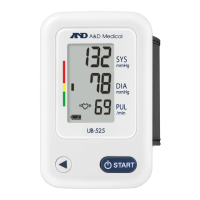
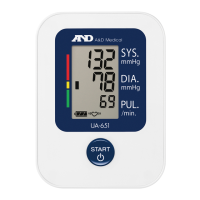
5.2.1.
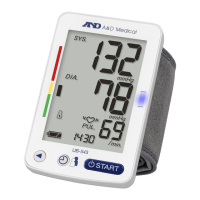
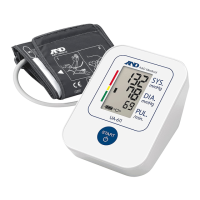
Liquid Crystal Display Panel ( LCD panel )
Upper figures
Middle figures
Lower figures
The following values can be displayed in each mode :
Measurement
Result
A-BPM S-BPM
Upper figures
Systolic blood
pressure
Interval time Program
Middle figures
Diastolic blood
pressure
Remaining time Pressure value
Lower figures Pulse Time of clock Time of clock
Refer to "3. Abbreviations & Symbols" for the meanings of
symbols on the LCD panel.