The Logbook and Daily Graph show detailed information, while other
history options show summaries of information over a number of days.
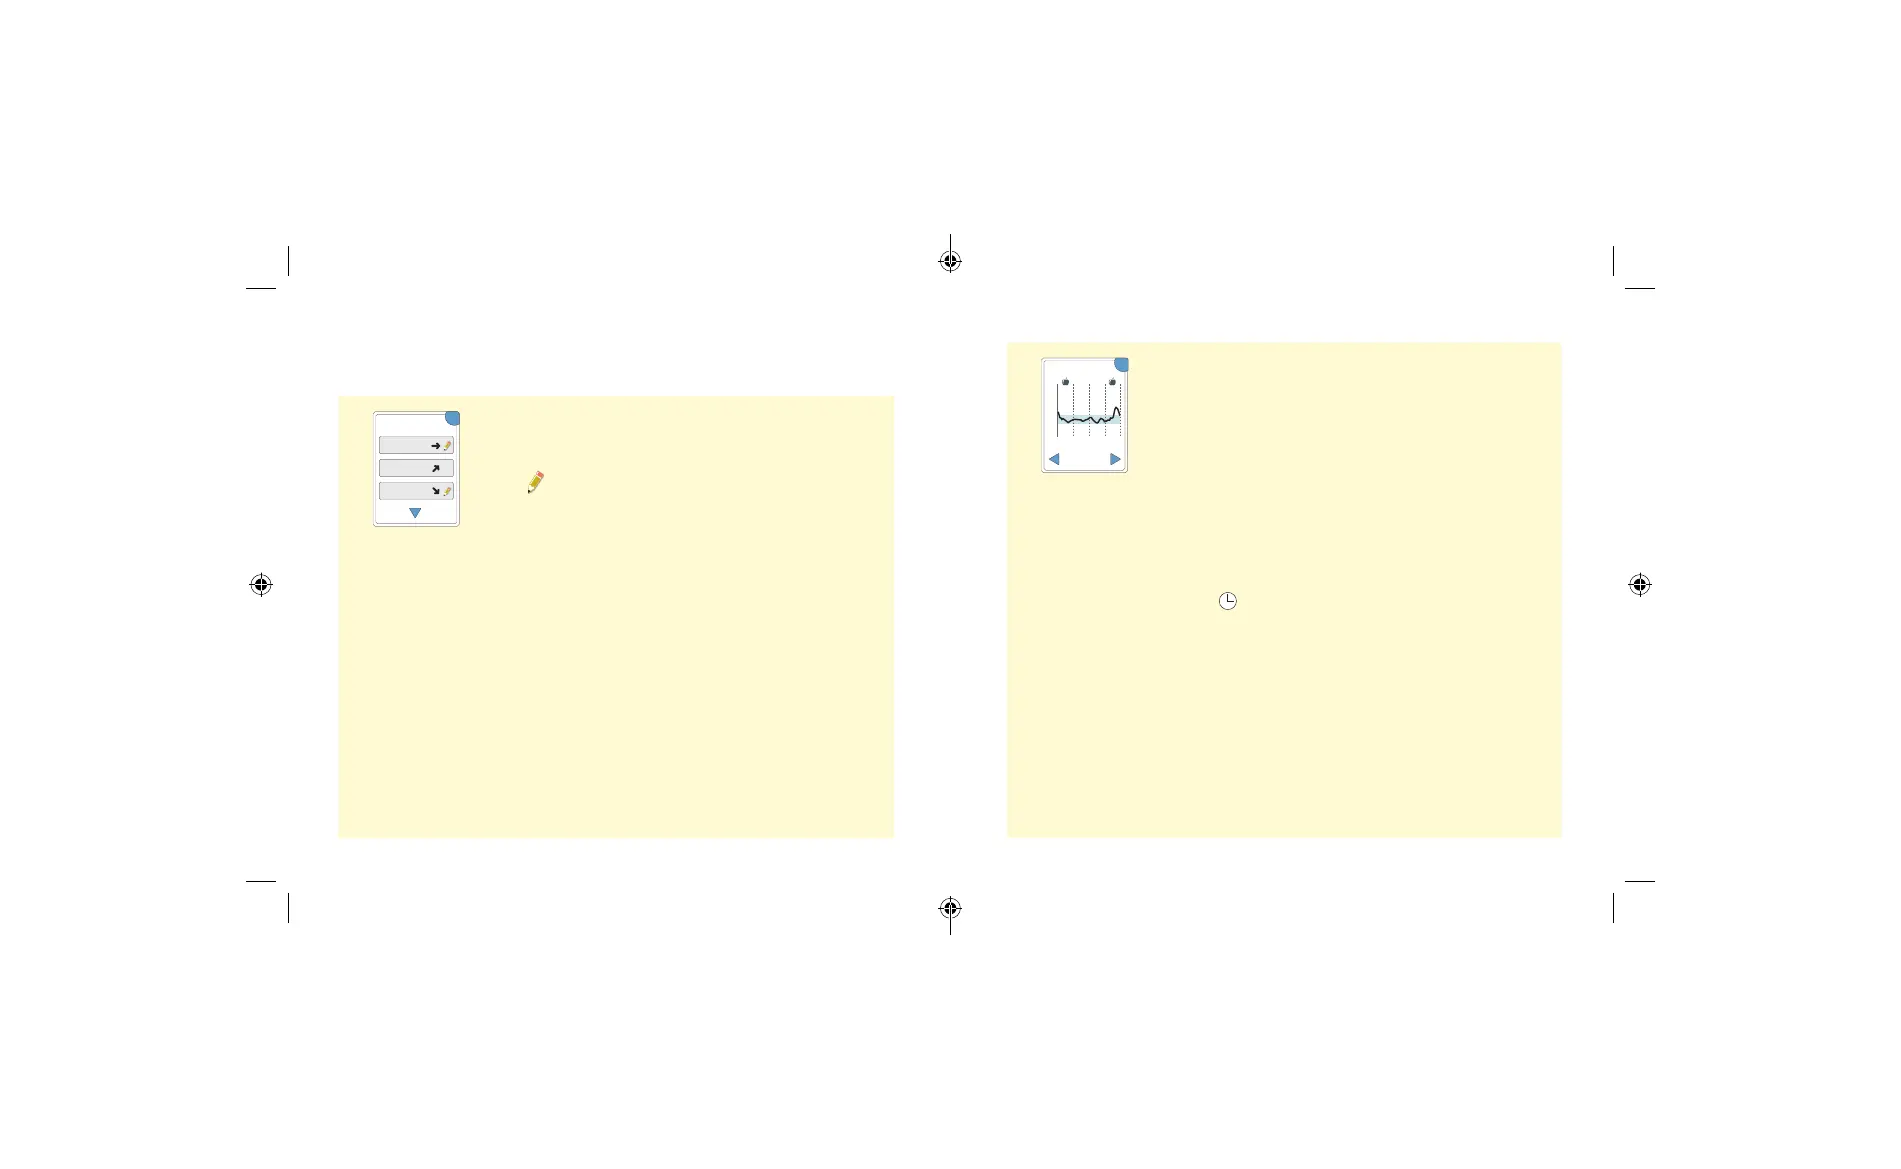
Logbook
OK
Logbook
23 Feb
10:23am
23 Feb
6:37am
22 Feb
11:09pm
7.9
5.4
6.0
mmol/L
Entries for each time you scanned your Sensor
or performed a blood glucose or ketone test.
If you entered Notes with a glucose reading,
the
symbol appears in that row. For more
information about the symbols, see Reader Symbols
section.
Touch the entry to review the detailed information,
including any Notes you entered. You can edit
(change) Notes for the most recent Logbook entry,
provided your glucose reading was within the last
15 minutes.
Daily Graph
12
am
6
am
12
pm
6
pm
12
am
21
15
9
3
OK
Daily Graph
(mmol/L)
22 Feb
Wednesday
A graph of your Sensor glucose readings by day.
The graph shows your Target Glucose Range and
symbols for food or rapid-acting insulin notes you
have entered.
Notes:
• The graph displays glucose readings up to
21 mmol/L. Glucose readings above 21 mmol/L
are displayed at 21 mmol/L.
• You might see gaps in the graph during
times when you have not scanned at least
once in 8 hours.
• The symbol may appear indicating the
Reader time was changed. Gaps in the graph
may result or glucose readings may be hidden.
45 46
ART43974_rev-A_manual.indd 45-46ART43974_rev-A_manual.indd 45-46 2/17/21 8:32 AM2/17/21 8:32 AM