Other History Options
Use the arrows to view information about your last 7, 14, 30, or 90 days.
OK
Last 7 Days
12
am am ampm pm
6 12 6 12
6.7
8.4
7.4
Average: 6.6 mmol/L
3.8
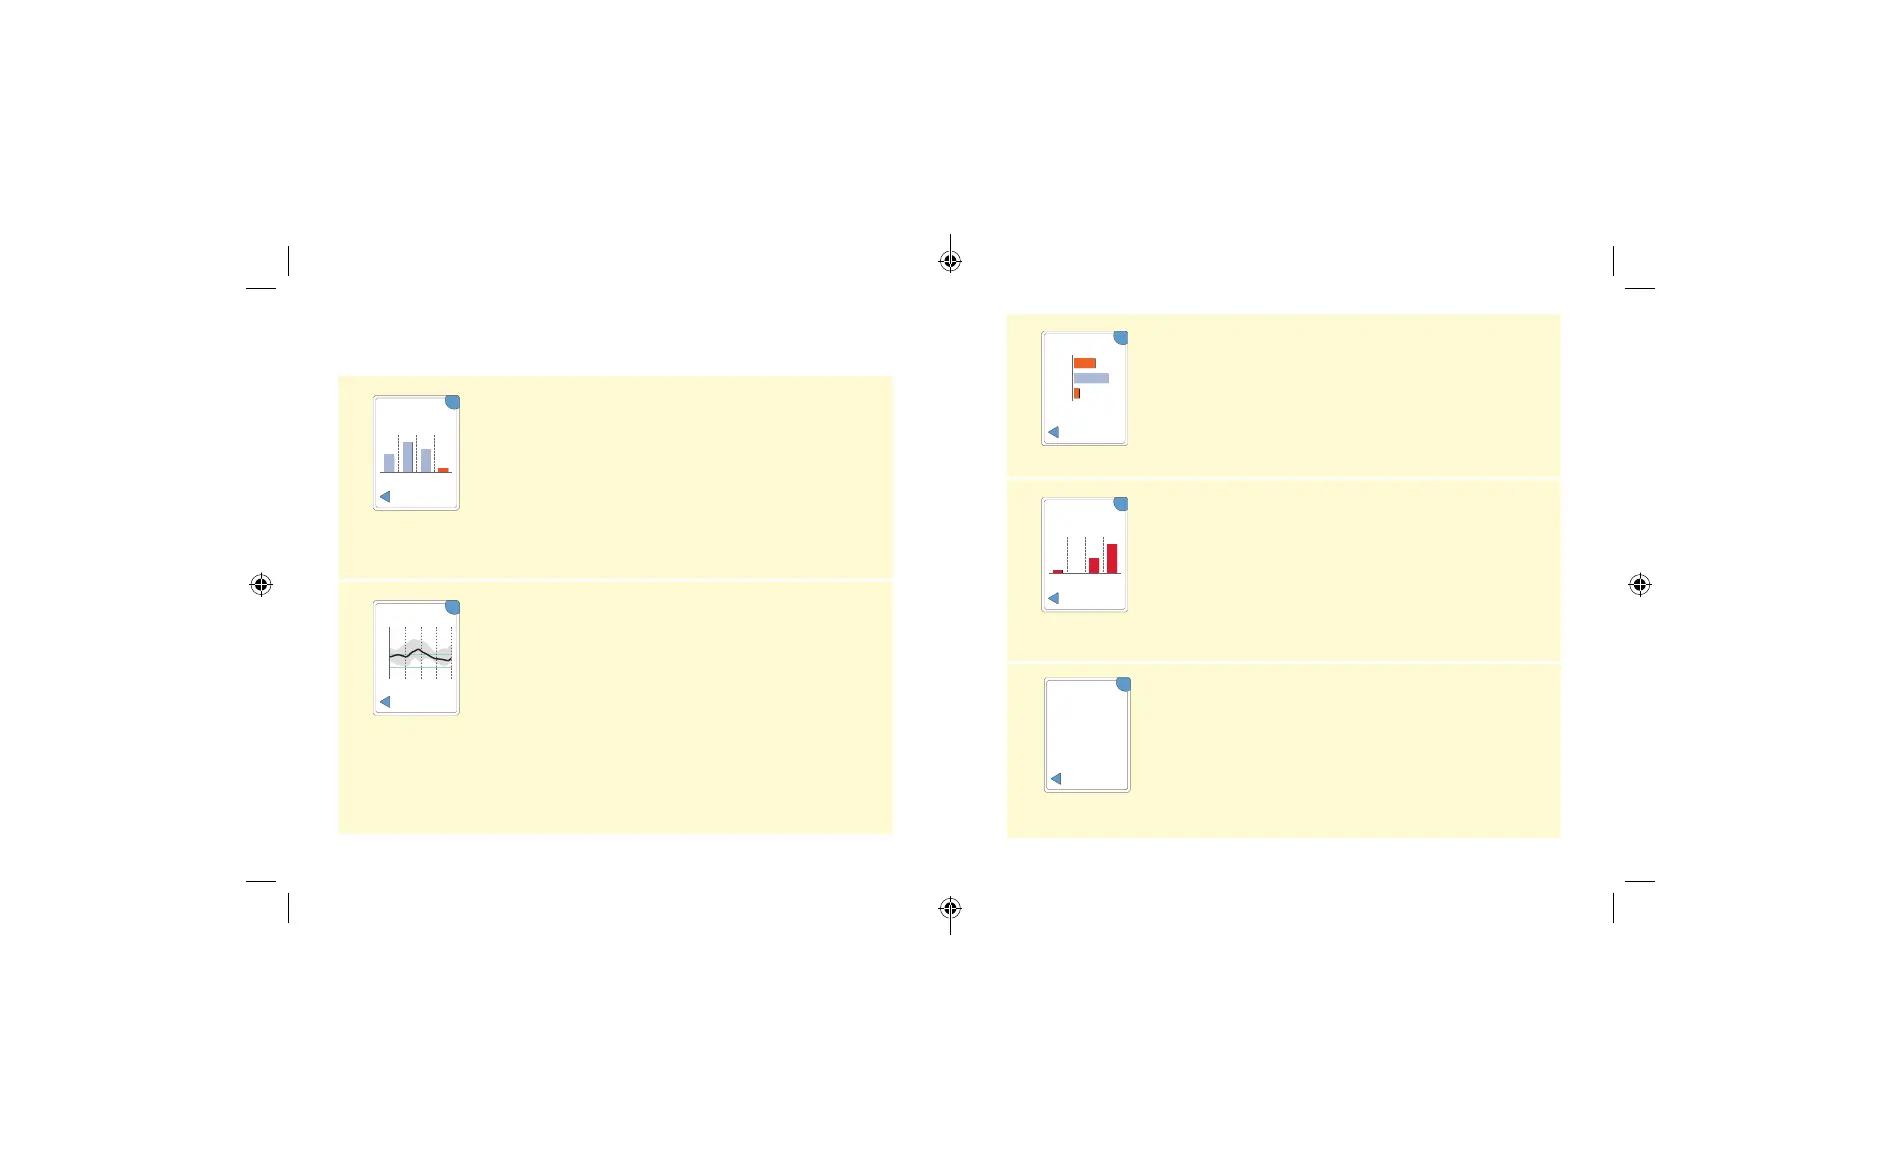
Average Glucose
Average Glucose
Information about the average of your Sensor
glucose readings. The overall average for the time
is displayed above the graph. The average is also
shown for four dierent 6-hour periods of the day.
Readings above or below your Target Glucose
Range are orange, while readings in range are blue.
12
am
6
am
12
pm
6
pm
12
am
21
15
9
3
OK
Daily Patterns
(mmol/L)
Last 7 Days
Daily Patterns
A graph showing the pattern and variability of your
Sensor glucose over a typical day. The thick black
line shows the median (midpoint) of your glucose
readings. The gray shading represents a range
(10-90 percentiles) of your Sensor readings.
Note: Daily Patterns needs at least 5 days of
glucose data.
OK
34%
54%
12%
Time In Target
Above
In Target
Below
Target Range
4.4-10.0 mmol/L
Last 7 Days
Time In Target
A graph showing the percentage of time your
Sensor glucose readings were above, below, or
within your Target Glucose Range.
OK
Last 7 Days
12
am am ampm pm
6 12 6 12
1
0
Total Events:
10
3
6
Low Glucose
Events
Low Glucose Events
Information about the number of low glucose
events measured by your Sensor. A low glucose
event is recorded when your Sensor glucose
reading is lower than 3.9 mmol/L for 15 minutes or
longer. The total number of events is displayed
above the graph. The bar graph displays the low
glucose events in four dierent 6-hour periods of
the day.
Sensor Usage
Information about how often you scan your Sensor.
The Reader reports an average of how many
times you scanned your Sensor each day, and the
percentage of possible Sensor data the Reader
recorded from your scans.
OK
100%
5
Scans Per
Day
Sensor Data
Captured
Sensor Usage
Last 7 Days
47 48
ART43974_rev-A_manual.indd 47-48ART43974_rev-A_manual.indd 47-48 2/17/21 8:32 AM2/17/21 8:32 AM