8.
Spurious Signals
(Harmonics &
Subharmonics)
Description
and Procedure
Use this
pro cedure
to measure
the syn
thesizer's harmonics
and
subharmonics
o
v
er
its
en
tire
frequency
range.
Harmonics
are
in
teger
m
ultiples
of
the
syn
thesizer
RF
output
frequency
and
subharmonics
are
fractional
multiples
of the
YO frequency
. Subharmonics
do
not
exist
at
all
frequencies. In
lo
w
band,
mixer
spurs
and
fundamen
tal
feedthrough
are
the
most
signican
t
harmonically-related
signals.
The
mixer
spur/YO
frequency
relationship
is
as
follo
ws:
X
(5.4
GHz
xed
oscillator)
0
Y
(YO
frequency)
= Mixer
Spur F
requency
where
X
and
Y
are
in
tegers.
Other
harmonics
are
t
ypically
direct
m
ultiples
of
the YO
frequency.
In
this
pro
cedure,
the
syn
thesizer
is
manually
swept
ov
er
its
frequency
range
while
the
sp
ectrum analyzer
measures the
harmonics
and
subharmonics
in
eac
h
frequency
band.
An
y
harmonics
or
subharmonics
that
are
within
5
dB
of
the
sp
ecication
are
subsequen
tly
v
eried
with
a
more
accurate
pro
cedure.
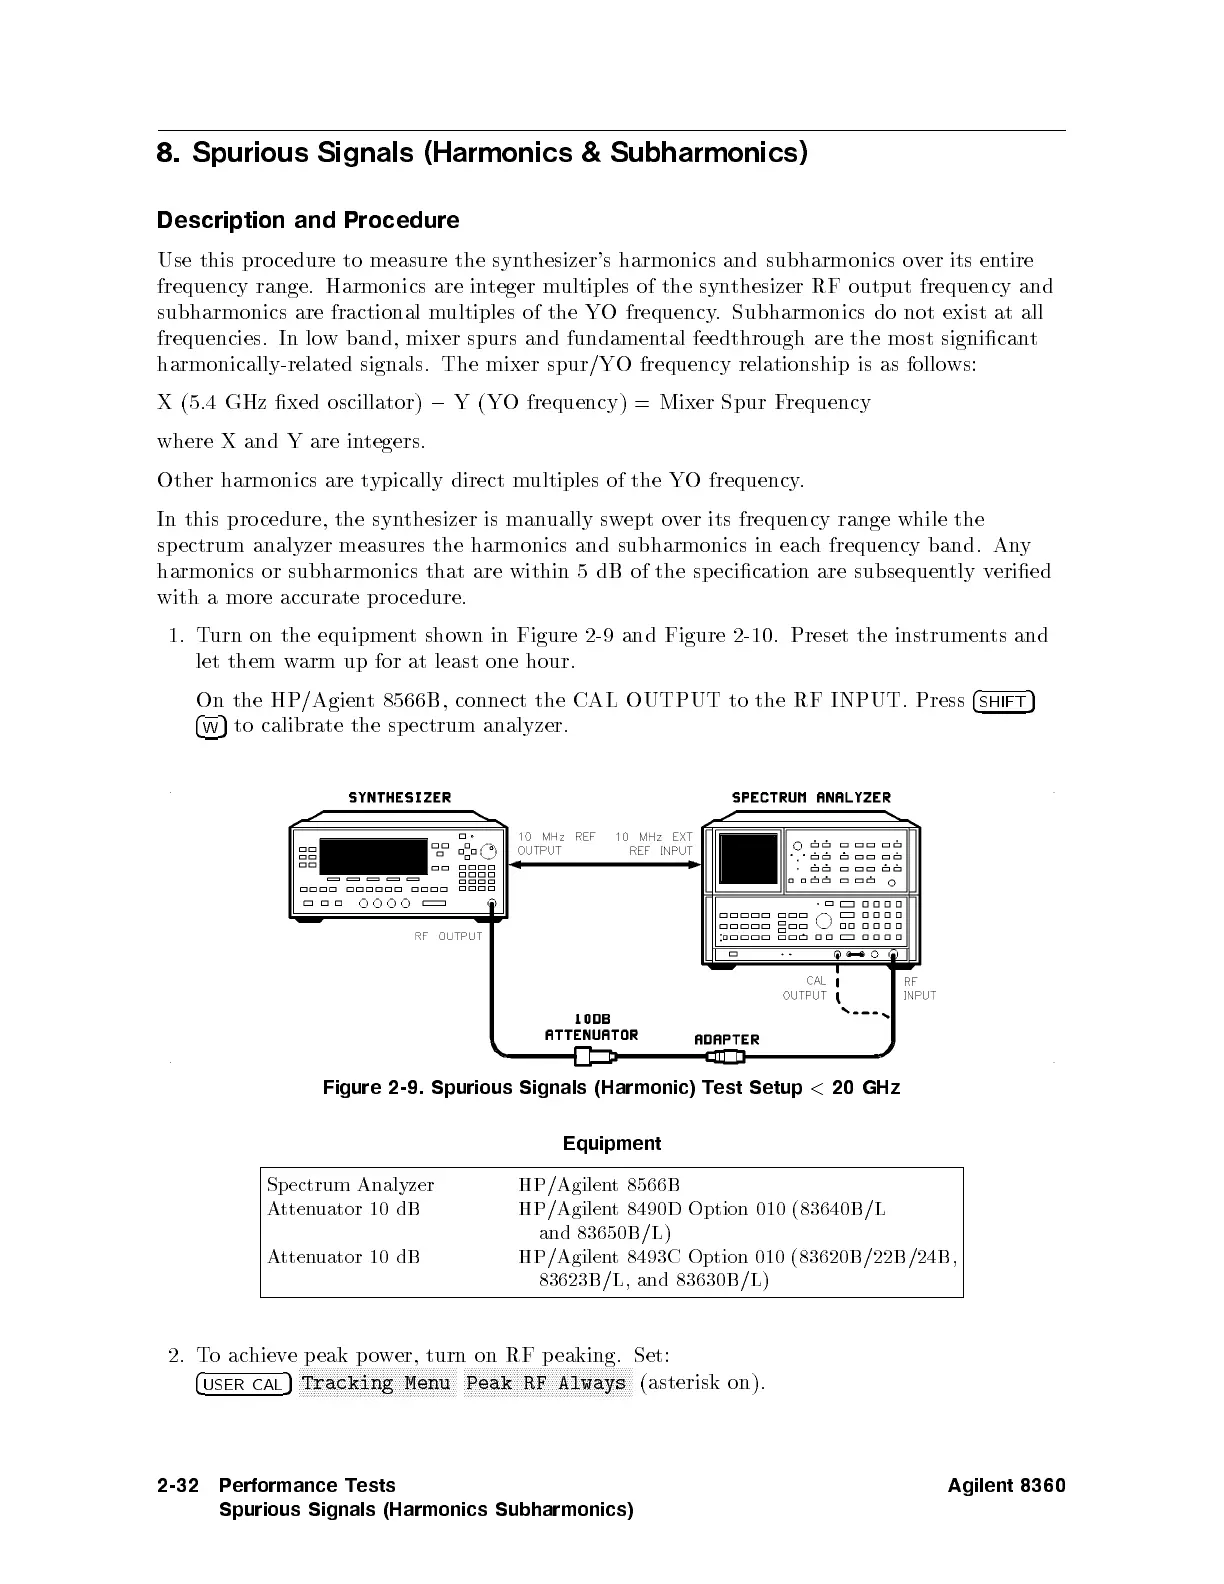
1.
T
urn
on
the
equipmen
t
sho
wn
in
Figure
2-9
and Figure
2-10.
Preset the
instruments
and
let
them
w
arm
up
for
at
least
one
hour.
On
the
HP/Agien
t
8566B,
connect
the
CAL
OUTPUT
to
the
RF
INPUT.
Press
4
SHIFT
5
4
W
5
to
calibrate
the sp
ectrum
analyzer.
Figure 2-9. Spurious Signals (Harmonic) T
est Setup
<
20 GHz
Equipment
Spectrum Analyzer
HP/Agilent 8566B
Attenuator 10 dB
HP/Agilent 8490D Option 010 (83640B/L
and 83650B /L)
Attenuator 10 dB
HP/Agilent 8493C Option 010 (83620B /22B/24B,
83623B/L, and 83630B/L)
2. Toachievepeakpower, turn on RF peaking. Set:
4
USER CAL
5
NNNNNNNNNNNNNNNNNNNNNNNNNNNNNNNNNNNNNNNNN
Tracking Menu
NNNNNNNNNNNNNNNNNNNNNNNNNNNNNNNNNNNNNNNNNNNN
Peak RF Always
(asterisk on).
2-32 Performance Tests
Spurious Signals (Harmonics Subharmonics)
Agilent 8360
 Loading...