10.
Spurious Signals
(Line-Related)
Description
and Procedure
Use this
pro cedure
to measure
line-related spurs.
The syn
thesizer
is
placed
at
a
CW
frequency
where
the
syn
thesizer
is
most
sensitiv
e
to
line-related
spurs.
The
sp
ectrum
analyzer
measures
the
RF
output
oset b
ythe
harmonics of
the line
p
o
w
er
frequency
(60
Hz
or
50
Hz).
T
o
eliminate measuring
the
sp
ectrum
analyzer
line-related
spurs,
an
In
v
ertron
is
used
to
op
erate
the
sp
ectrum
analyzer
at
a
dieren
t
line
frequency
so that
its o
wn spurs
will not
aect
the
measuremen
t.
The sp
ectrum analyzer
must
hav
e
the
capabilit
y
of
a
10
Hz
resolution
bandwidth.
A
wider
resolution
bandwidth
results
in
the
syn
thesizer's
phase
noise
masking
the
spur.
1.
Set
the
In
v
ertron
for
a
line
frequency of
55 Hz
and for
normal
op
erating
v
oltage.
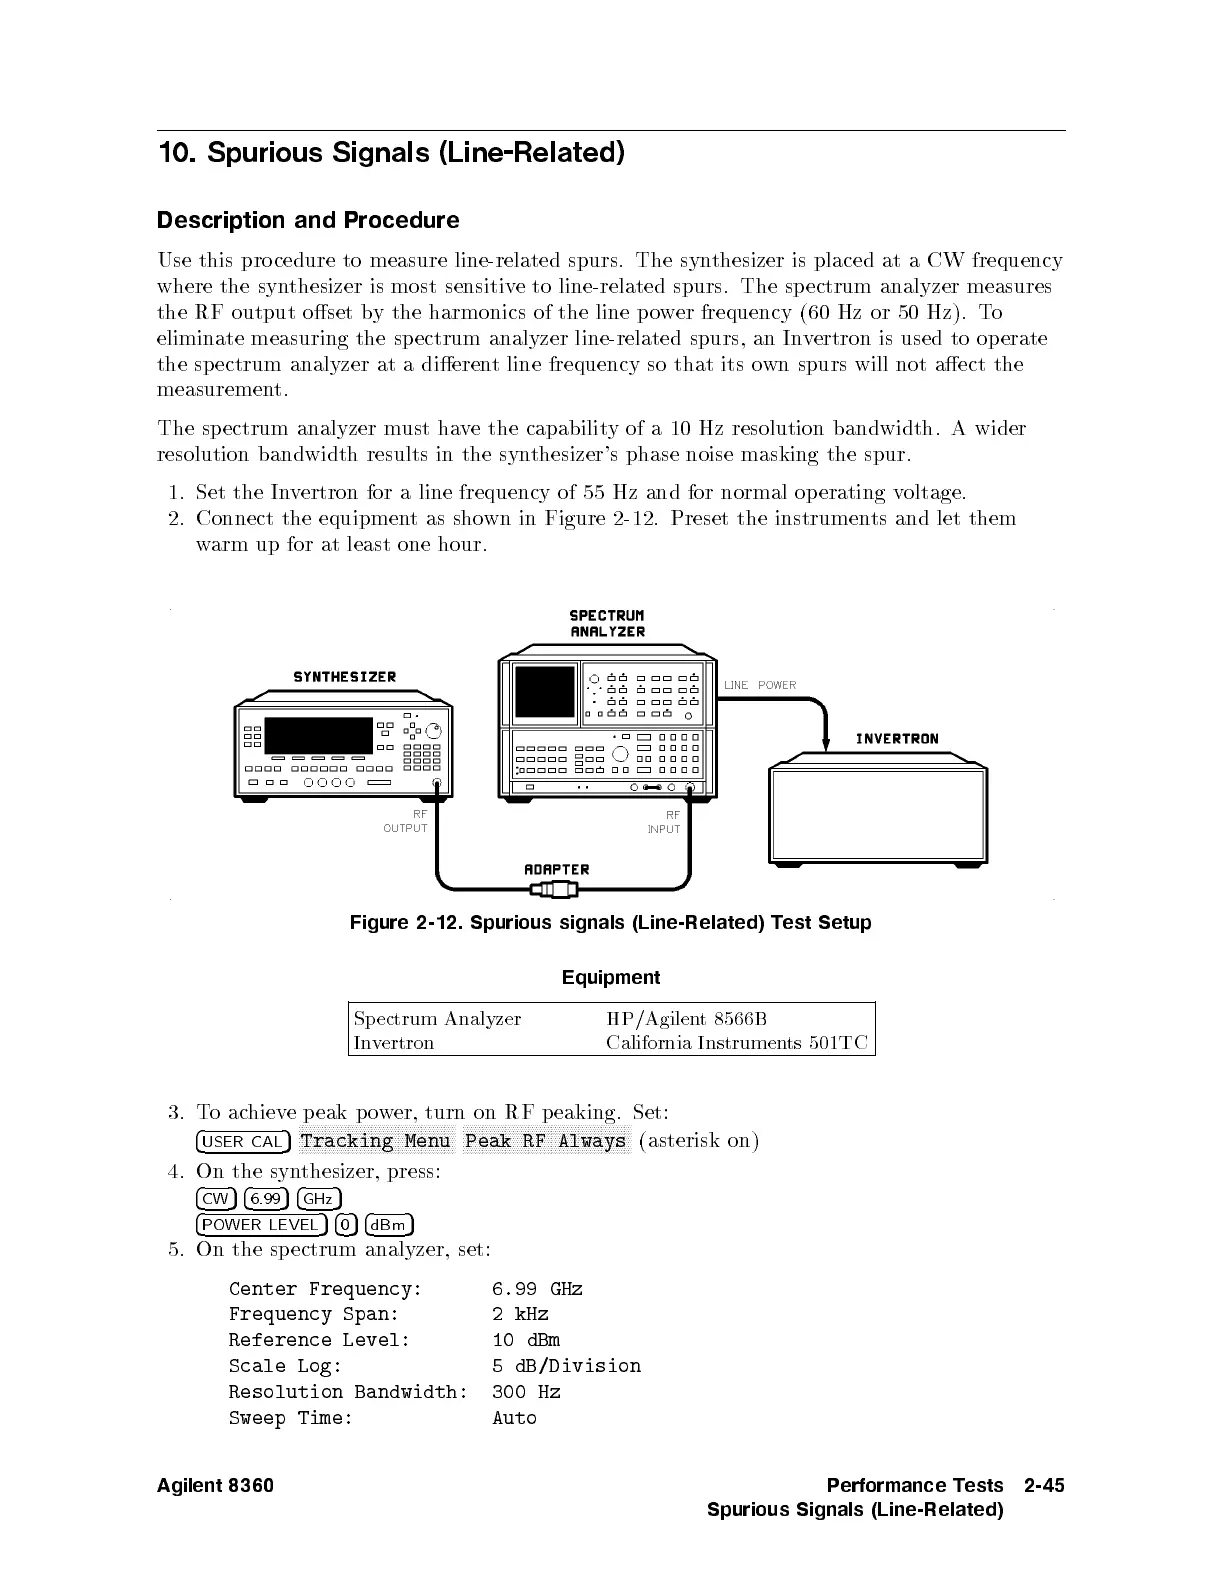
2. Connect
the equipmen
tas
sho
wn
in
Figure
2-12
.
Preset
the
instrumen
ts
and
let
them
w
arm
up
for
at
least
one
hour.
Figure 2-12.
Spurious signals
(Line-Related) T
est Setup
Equipment
Sp
ectrum
Analyzer
HP/Agilen
t
8566B
In
v
ertron
California
Instrumen
ts
501TC
3.
Toac
hieve p eak p o
wer, turn on RF p eaking. Set:
4
USER CAL
5
NNNNNNNNNNNN
NNNNNNNNNNNNNNNNNNNNNNNNN
NNNN
Tracking Menu
NNNNNNNNNNNN
NNNNNNNNNNNNNNNNNNNNNNNNN
NNNNNNN
Peak RF Always
(asterisk on)
4. On the syn
thesizer,
press:
4
CW
54
6.99
54
GHz
5
4
POWER LEVEL
54
0
54
dBm
5
5. On the spectrum analyzer, set:
Center Frequency: 6.99 GHz
Frequency Span: 2kHz
Reference Level: 10 dBm
Scale Log: 5 dB/Division
Resolution Bandwidth: 300 Hz
Sweep Time: Auto
Agilent 8360 Performance Tests
Spurious Signals (Line-Related)
2-45
 Loading...