6. On
the sp
ectrum analyzer,
set the
marker
to the
highest p
eak
and
then
set
the
mark
er
to
center
frequency.
Decrease
the
frequency
span
to
100
Hz
k
eeping
the
signal
centered
on
the
displa
y
and
then
rep
eat the
marker
peak
search
and set
the mark
er to
cen
ter
frequency.
7.
Note the
signal
amplitude
on
the
sp
ectrum
analyzer.
This
is
the
carrier
amplitude to
whic
h
the
spurs
are
referenced.
dBm
Carrier
Amplitude
8.
Use the
following
pro cedure
to
determine
the
actual
frequency
of
the
spurs
in
T
able
2-12
:
a.
On
the
synthesizer,
press:
4
SERVICE
5
N
N
N
N
N
N
N
N
NN
NN
NN
NN
N
N
N
N
N
N
N
N
N
N
N
N
N
N
N
N
N
NN
Adjust
Menu
N
N
N
N
N
N
N
N
NN
NN
NN
NN
N
N
N
N
N
N
N
N
N
N
N
N
N
N
N
N
Calib
Menu
N
N
N
N
N
N
N
N
NN
NN
NN
NN
N
N
N
N
N
N
N
N
N
N
N
N
N
N
N
N
Select
Cal
.
b.
Use
the
RPG
knob
to
select
the
rst calibration
constant
in T
able 2-12
(#18).
c.
To
the v
alue of
the
sp
ectrum
analyzer
cen
ter
frequency
(19.765
GHz),
add
the
v
alue
of
the
calibration
constan
t
(or
t
wice
the
v
alue,
as
indicated
in
T
able
2-12
)
and the
value
from
the
second
column
of
T
able
2-12
(20 kHz).
Record this
value
(in
Hz)
in
the
last
column
of T
able 2-12
.
For
example:
19.765
GHz
(Spectrum
analyzer
center
frequency)
+
338 kHz
(Possible value
of calibration
constant #18
+
20
kHz
(Value
from
second
column
of
the table)
---------------------------------------------------------
-------------
=
19,765,358,000 Hz
(Record
this
result
in
the
last
column
of
the
table.)
Rep
eat
this
pro
cedure
for
the
remaining calibration
constan
ts
in
T
able
2-12
.
The
last
t
w
o
actual
spur
frequencies
ha
v
e
already
b
een
calculated
and are
not
related
to
calibration
constan
ts.
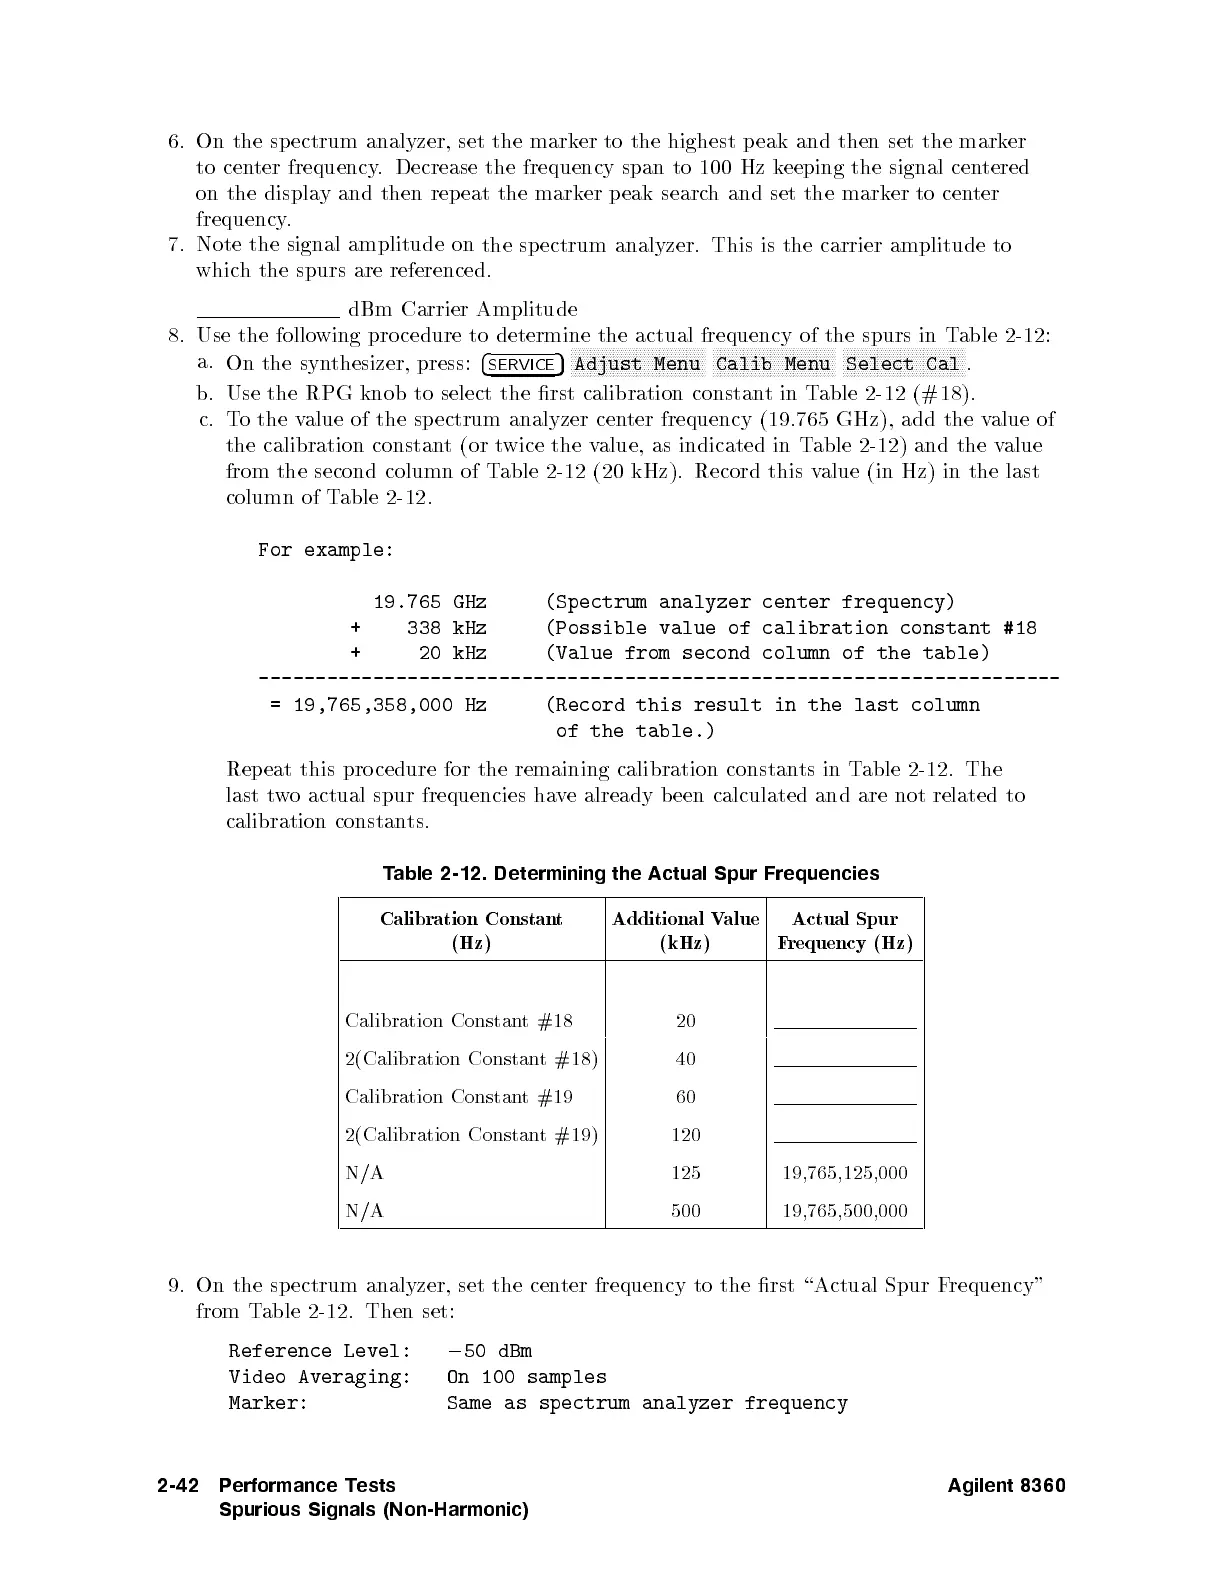
T
able
2-12.
Determining
the
Actual
Spur
Frequencies
Calibration Constan
t
(Hz)
Additional V
alue
(kHz)
Actual Spur
Frequency
(Hz)
Calibration
Constan
t
#18
20
2(Calibration
Constant
#18)
40
Calibration Constan
t#19
60
2(Calibration Constan
t #19)
120
N/A 125 19,765,125,000
N/A 500 19,765,500,000
9. On the spectrum analyzer, set the center frequency to the rst \Actual Spur Frequency"
from Table 2-12. Then set:
Reference Level:
0
50 dBm
Video Averaging: On 100 samples
Marker: Same as spectrum analyzer frequency
2-42 Performance Tests
Spurious Signals (Non-Harmonic)
Agilent 8360

 Loading...


