Chapter 7 93
Characteristics
SRL Measurement Uncertainty vs Connector Fault
Example:
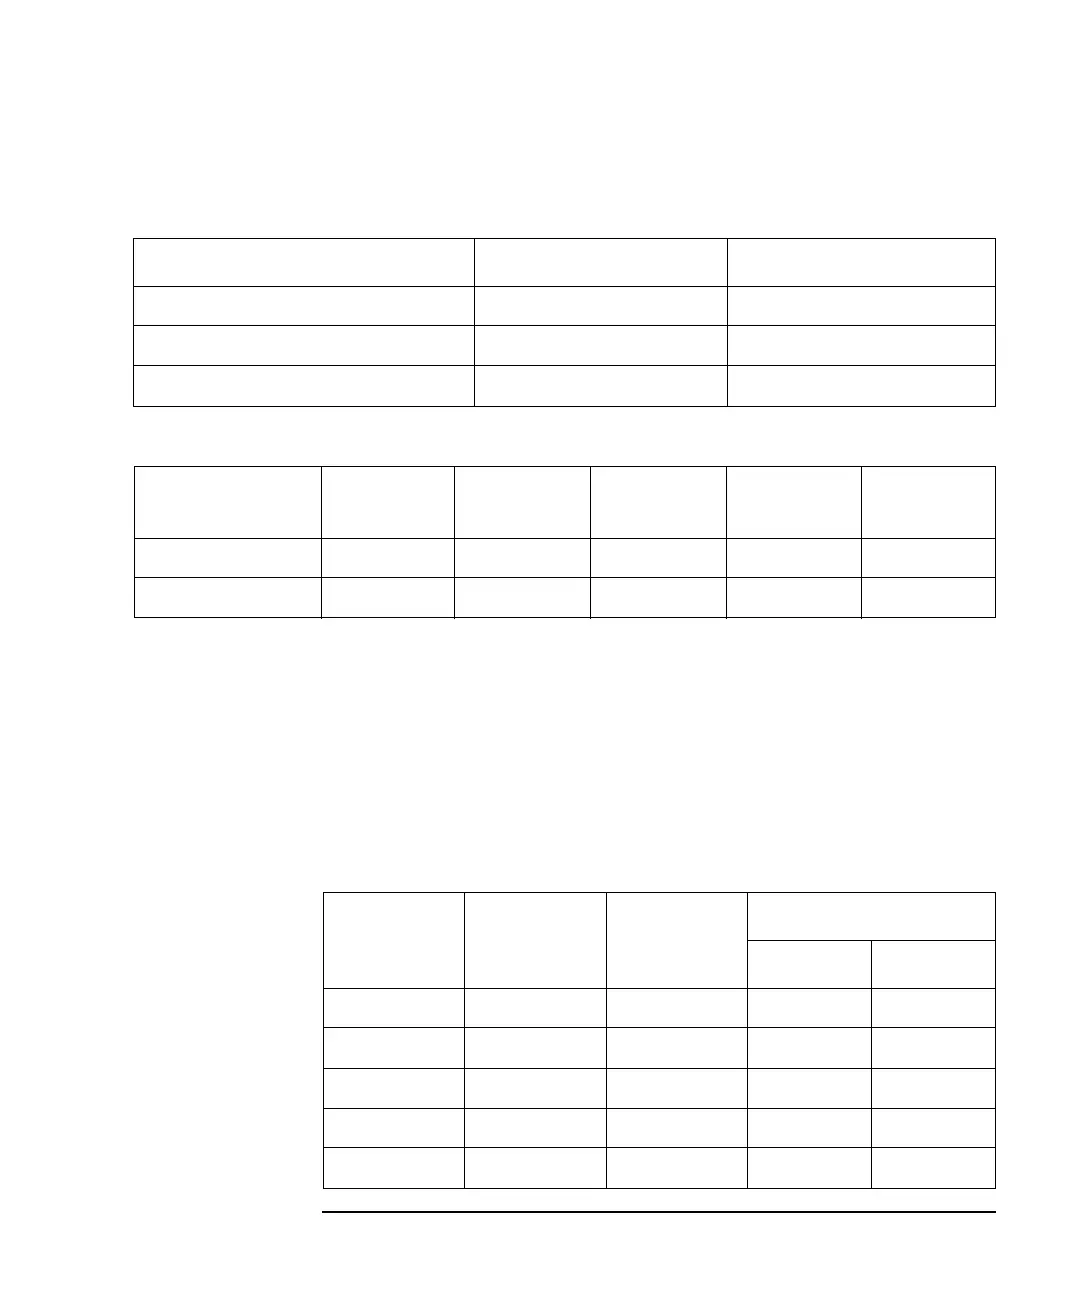
Table 7-4 Uncertainty Worksheet 1
Table 7-5 Uncertainty Worksheet 2
Measurement uncertainty = −32 dB +2.03/−2.7 dB
Measurement Uncertainty Tables
The following tables show the relationship between the corrected connector fault
response, industry standard SRL cable specifications, and the maximum and
minimum measured SRL responses. The tables also take into account the affects of
system directivity (which can be determined from the trace with a load connected
after calibration).
Table 7-6 Measurement Uncertainty with a −20 dB SRL Response
Measurement Log (dB) Refl. Coef. (Linear)
SRL Response −32 dB 0.0251
Connector Response −50 dB 0.00316
System Directivity −49 dB 0.00354
Operation
SRL
Response
Connector
Response
System
Directivity
Result
(Linear)
Result (dB)
Max (add) 0.0251 0.00316 0.00354 0.0318 −29.97
Min (subtract) 0.0251 0.00316 0.00354 0.0184 −34.70
Corrected
Connector
System
Directivity
SRL (Actual)
SRL (Measured)
Max Min
−20 dB −49 dB −20 dB −13.83 dB −49 dB
−25 dB −49 dB −20 dB −15.93 dB −27.91 dB
−30 dB −49 dB −20 dB −17.38 dB −23.76 dB
−35 dB −49 dB −20 dB −18.32 dB −22.08 dB
−40 dB −49 dB −20 dB −18.9 dB −21.26 dB
 Loading...


