Chapter 5 Generating Data from RQ Plates – 7500 Fast System
Analyzing and Viewing RQ Plate Data
Applied Biosystems 7300/7500/7500 Fast Real-Time PCR System Relative Quantification Getting Started Guide 53
Notes
FAST
FAST
5
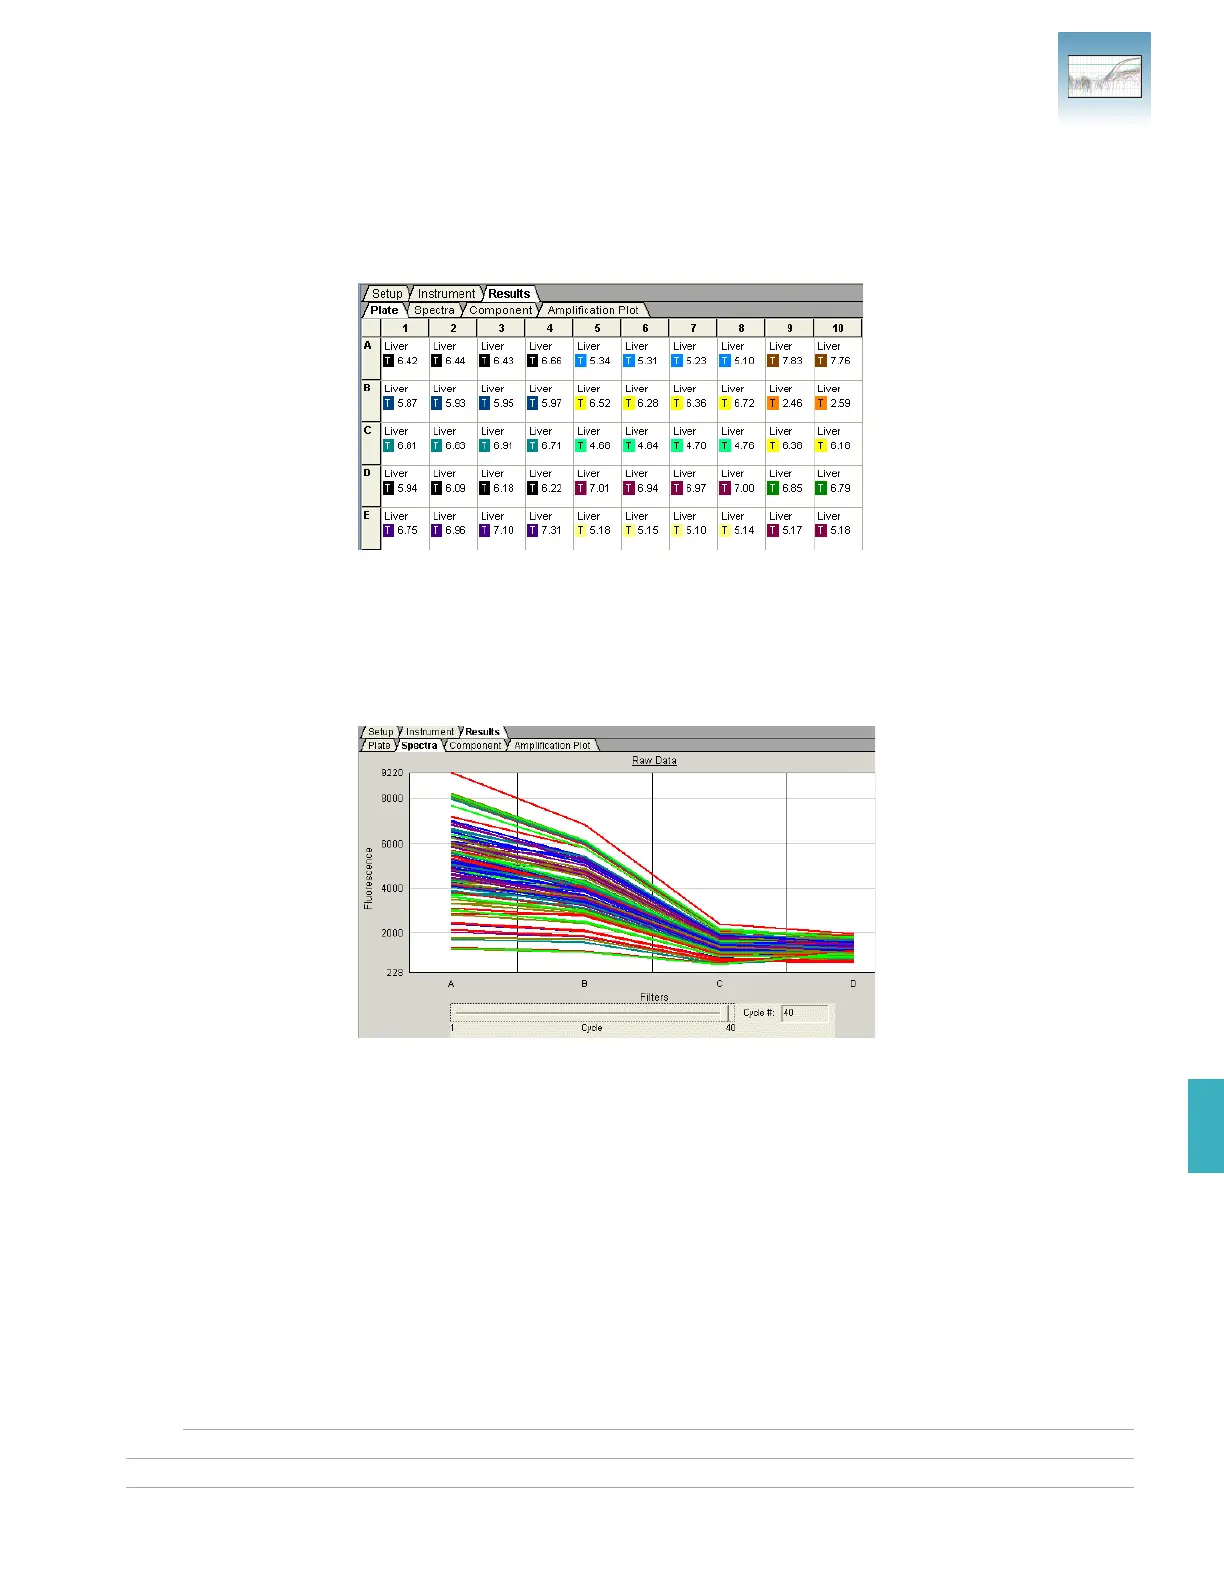
Plate Tab Displays the results data of each well, including the:
• Sample name and detector task and color for each well
• Calculated R
n
value
Spectra Tab Displays the fluorescence spectra of selected wells.
• The Cycles slider allows you to see the spectra for each cycle by dragging it with
the pointer.
• The Cycle # text box shows the current position of the slider.
Component Tab Displays the complete spectral contribution of each dye in a selected well over the
duration of the PCR run. Only the first selected well is shown at one time.