Chapter 5 Generating Data from RQ Plates – 7500 Fast System
Analyzing and Viewing RQ Plate Data
54 Applied Biosystems 7300/7500/7500 Fast Real-Time PCR System Relative Quantification Getting Started Guide
Notes
FAST
FAST
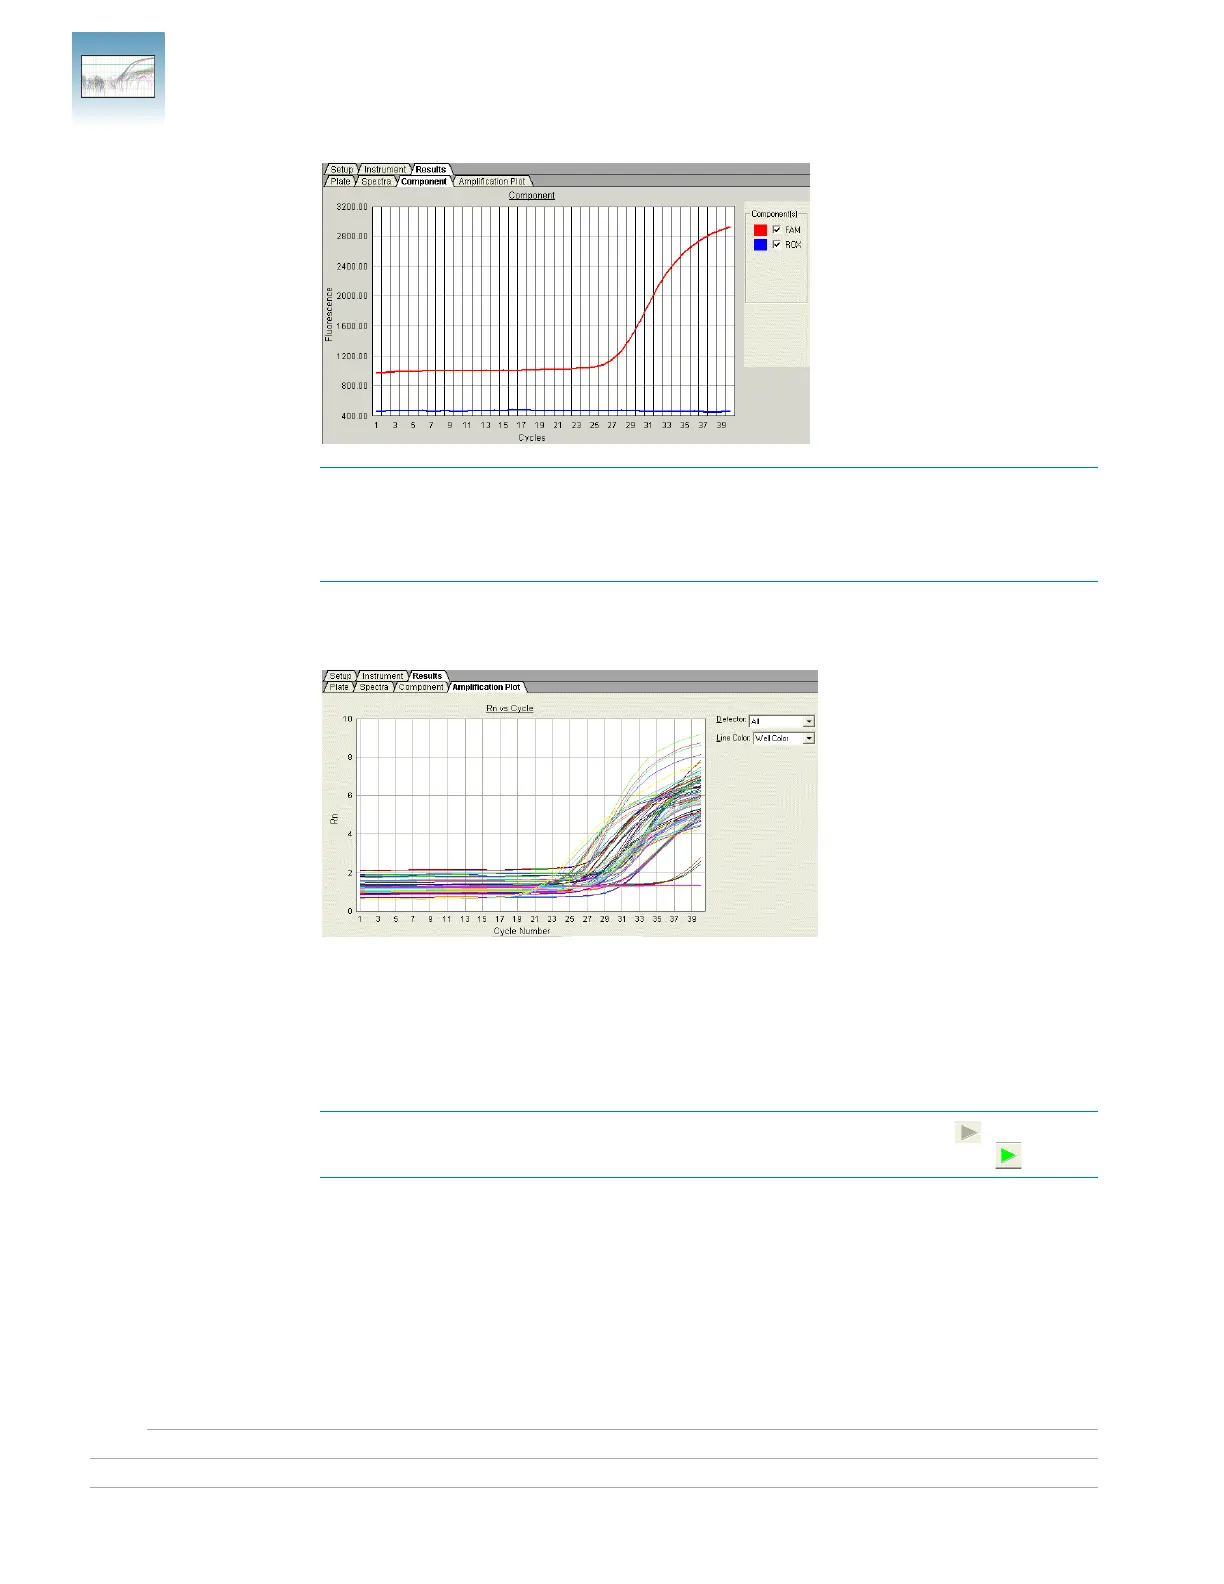
Note: If you are using TaqMan
®
products, three components (ROX
™
dye, reporter dye,
and TAMRA
™
quencher) are displayed in the Component tab. If you are using TaqMan
®
MGB products, only two components (ROX and reporter dyes) are displayed, as shown
in the figure on the right.
Amplification Plot
Tab
Displays a plot of R
n
as a function of cycle number for the selected detector and well(s).
Reanalyzing Data Raw fluorescence data (spectra), R
n
values, and well information (sample name,
detector, and detector task) are saved in an RQ plate document.
If you decide to omit wells or change well information after a run is complete, you must
reanalyze the data.
Note: After the software analyzes data, the Analyze button is disabled ( ). Whenever
you change a setting that requires reanalysis, the Analyze button is enabled ( ).