04/03 347 LB 444
59
8.1.3 Two and Multi-Point Calibration
The gradient of the calibration curve can be determined accurately by two-point calibra-
tion. Multi-point calibration helps to exclude errors made during sampling and analysis.
Furthermore, the output signal is in linear proportion to the concentration, even though
the density is not linear to the concentration. For multi-point calibration, enter the count
rate obtained at various density values in the submenu Data input, Rate 1. to Rate 10
and the density or concentration value in the corresponding rows. The procedure is the
same as with one-point calibration (see 6.2.2 Calibration).
For multi-point calibration, the respective values should be entered in the Product Data
menu, submenu item Current Output Limits.
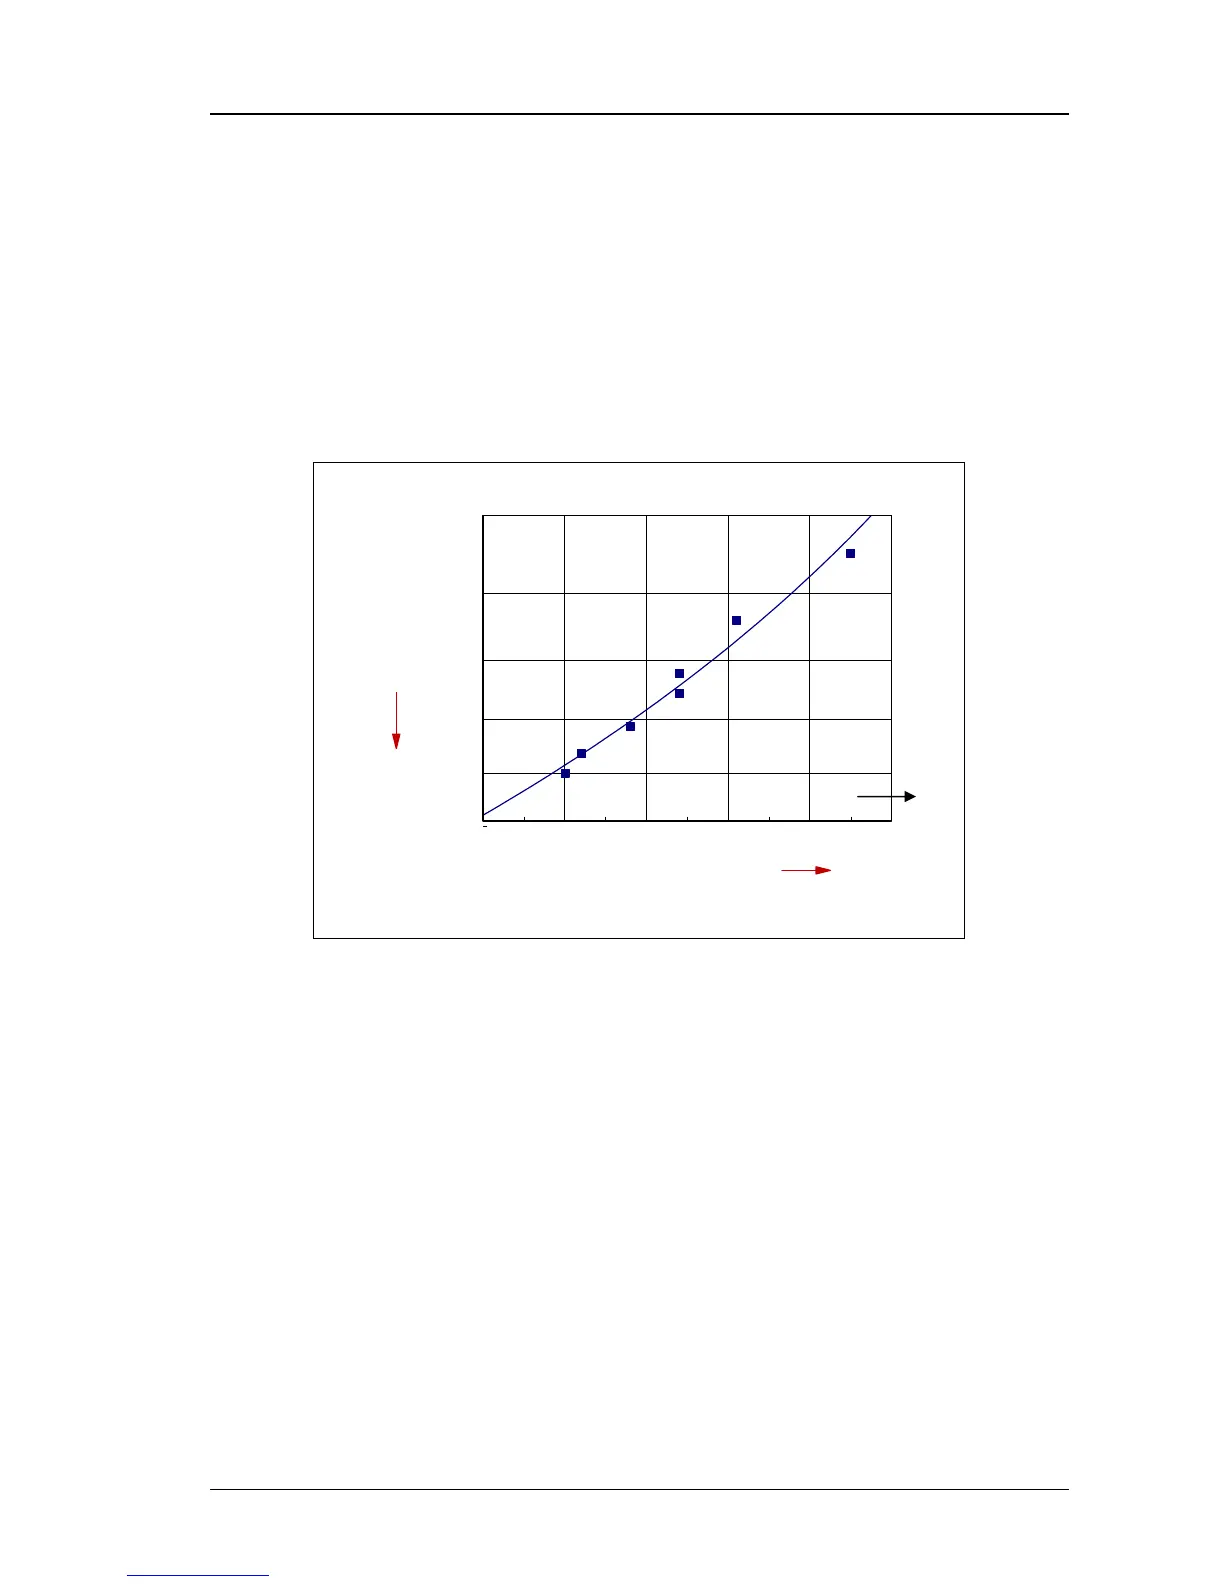
0,9 1 1,1 1,2 1,3 1,4
6.000
7.000
8.000
9.000
10.000
11.000
Density in g/ccm
cps
Figure 27: Example of multi-point calibration
You need not observe a rising or falling order when entering sample values. However,
proper correlation of count rate and density value is important.
The values have to be available in pairs. If the associated density or concentration value
is missing, the count rate is automatically given the density or concentration “0”.
Remedy:
Entered data can be corrected as needed since calibration is performed in the menu item
Calculate after selection of the calibration mode.