04/03 347 LB 444
65
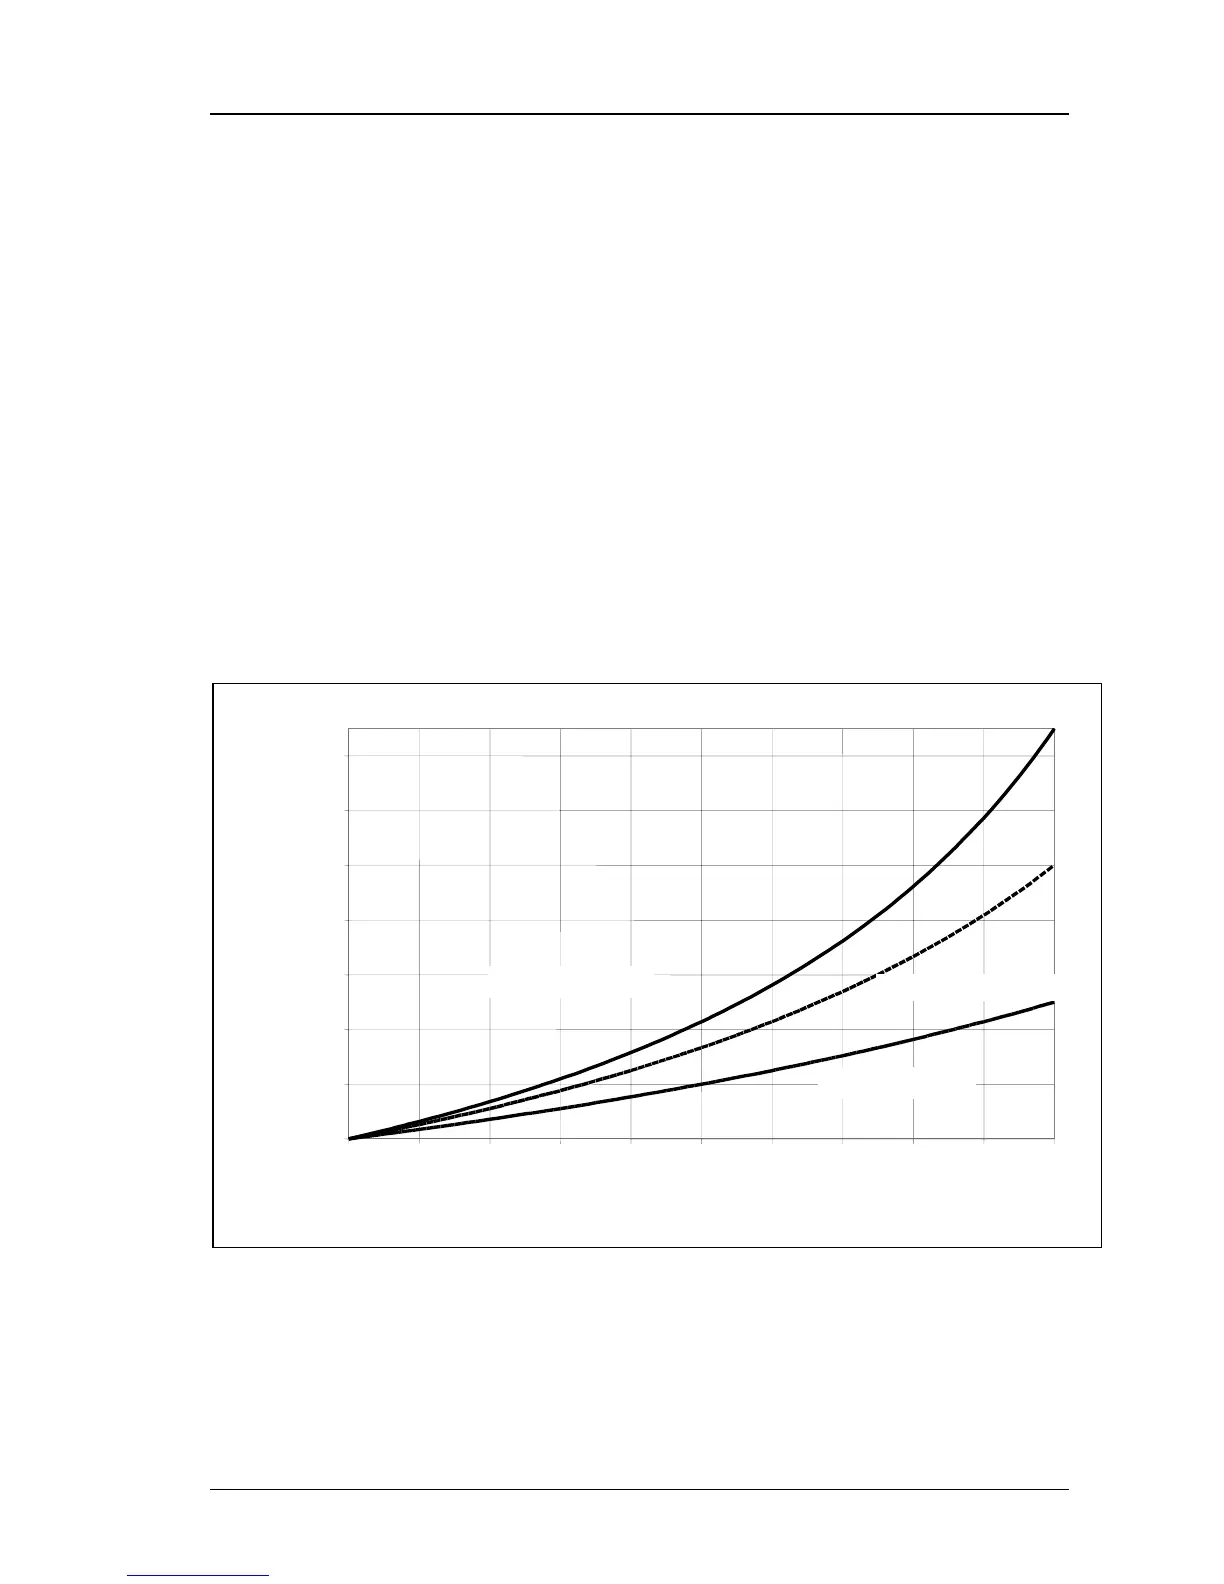
8.4 Measurements of Suspensions
Clear correlation of density and concentration is possible only when
• liquid density and
• solid density
are constant.
Density or concentration measurements of suspensions can be carried out in these units:
a) Density in g/cm
3
b) Concentration in g/l
c) Concentration in weight-%
d) °Be
Data input, calibration and display are carried out in the selected unit of measure. For
calculation of the calibration curve, the values entered under b) through d) will be con-
verted into g/cm
3
.
Through conversion, a correct characteristic line can be obtained for suspensions already
with one or two calibration points.
Values with the units b) to d) are internally converted into g/cm3 in order to obtain the
curvature of the characteristic curve.
Figure 29: Density of suspensions
1.0000