43
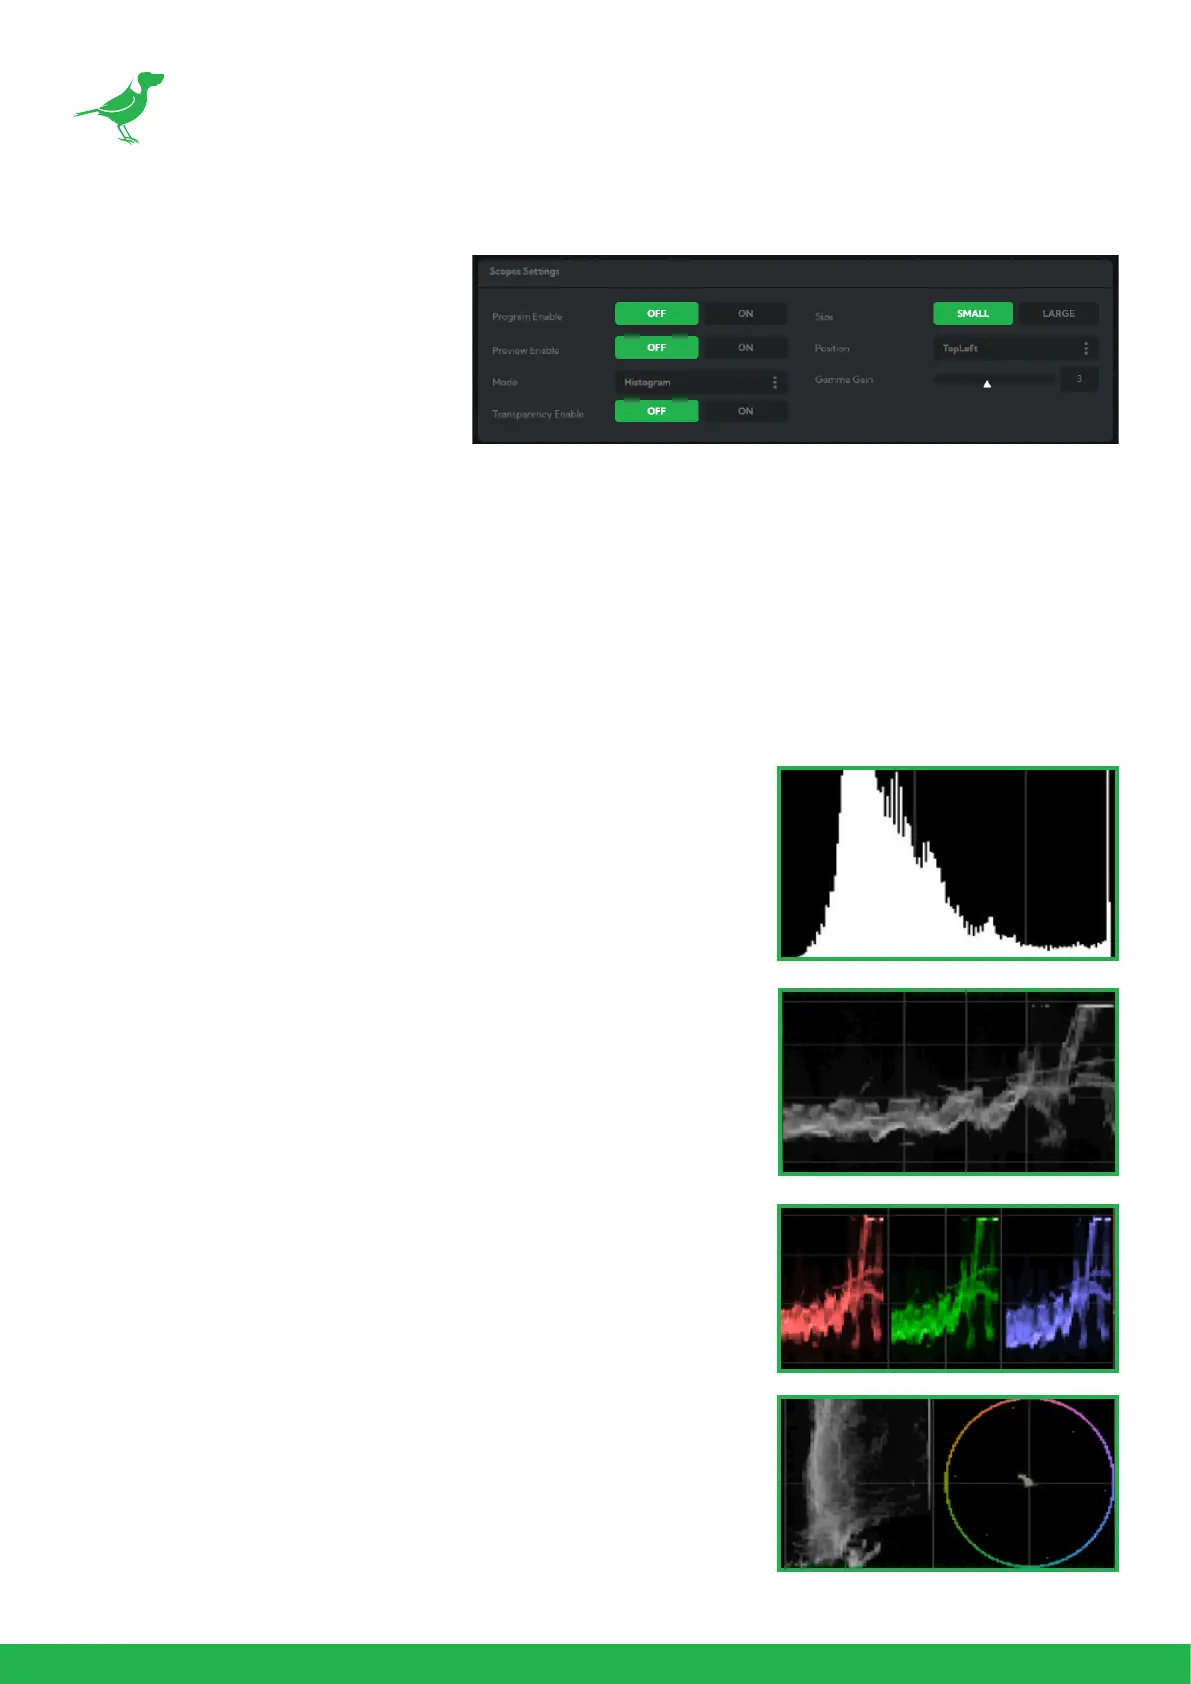
Scopes
Since there is variation in both the
eyesight of individuals and video
monitors, Cam Control oers NDI®
video scopes to assist in evaluating the
color and tonal qualities of your image.
Program / Preview Enable: Choose
to overlay the scopes on either the pro-
gram output, the preview output or
both.
Transparency Enable: Click the ON button to enable scope transparency, allowing the video image to be visi-
ble behind the scopes.
Size: Click the desired scope size.
Position: Selects the position of the overlayed scope on the video image. Select from Top Left, Top Right, Bottom
Left and Bottom Right.
Gamma Gain: Adjusts the brightness of the displayed scopes.
Mode
Histogram: The Histogram shows the distribution of luminance (brightness)
in the image, from darker pixels on the left of the scope, to brighter pixels
on the right. The height of the curve is a measure of the number of pixels
in the image with a particular luminance value. Unlike the Waveform or
RGB Parade scope, the Histogram does not indicate the left to right
physical position of the luminance values in the image.
Waveform: The Waveform scope shows the distribution of luminance in
the image as a waveform that ranges from zero at the lower horizontal
line, to 100 % intensity at the upper horizontal line. The left to right position
of the values match their position in the image.
RGB Parade: The RGB Parade shows the intensity of Red, Green and Blue
in the image as separate waveforms that range from zero at the lower
horizontal line, to 100 % intensity at the upper horizontal line. For each
waveform, the left to right position of the values match their position in
the image.
Vector: The Vectorscope is a circular graph that displays the chrominance
(hue and saturation) of the image colors. The distance from the center
indicates the degree of color saturation, from zero intensity at the center
of the circle, to 100% intensity at the edge of the circle.
The graph is divided into color segments, each indicated by the colored
perimeter of the circle, showing the dispersion of color in the image. A
Waveform scope is also displayed on the left side of the Vectorscope.
 Loading...