Logamatic EMS – 6 720 801 386 2011/05
21
Principles of operation
4
Graph displays in the INFO menu (outside temperature variation and solar gain)
The INFO menu gives you the option of, for example, viewing graphs showing the variation in outside
temperature over the past two days and (if solar components are installed) the solar gain. This way
you have a clear overview allowing easy comparison of the relevant values.
Outside temperature variation (weather station)
The temperature variation over the current and previous day is shown across two screens. In
addition the minimum and maximum values since 0:00 on the previous day are shown.
Solar gain
1)
The solar gain display (current and previous day) tells you how much the solar collector has
contributed to DHW heating. This is calculated using the temperature differential between the
cylinder and the solar collector in conjunction with the modulation of the solar circuit pump.
The solar gain is highly dependent on the system installed and its components and therefore cannot
be expressed as a value in kWh. This means that the value displayed is a variable specific to the
particular system, which cannot be easily compared with other solar thermal systems. However, it is
very useful for comparing the amount of gain on different days.
This information is displayed as a graph for the previous and current day.
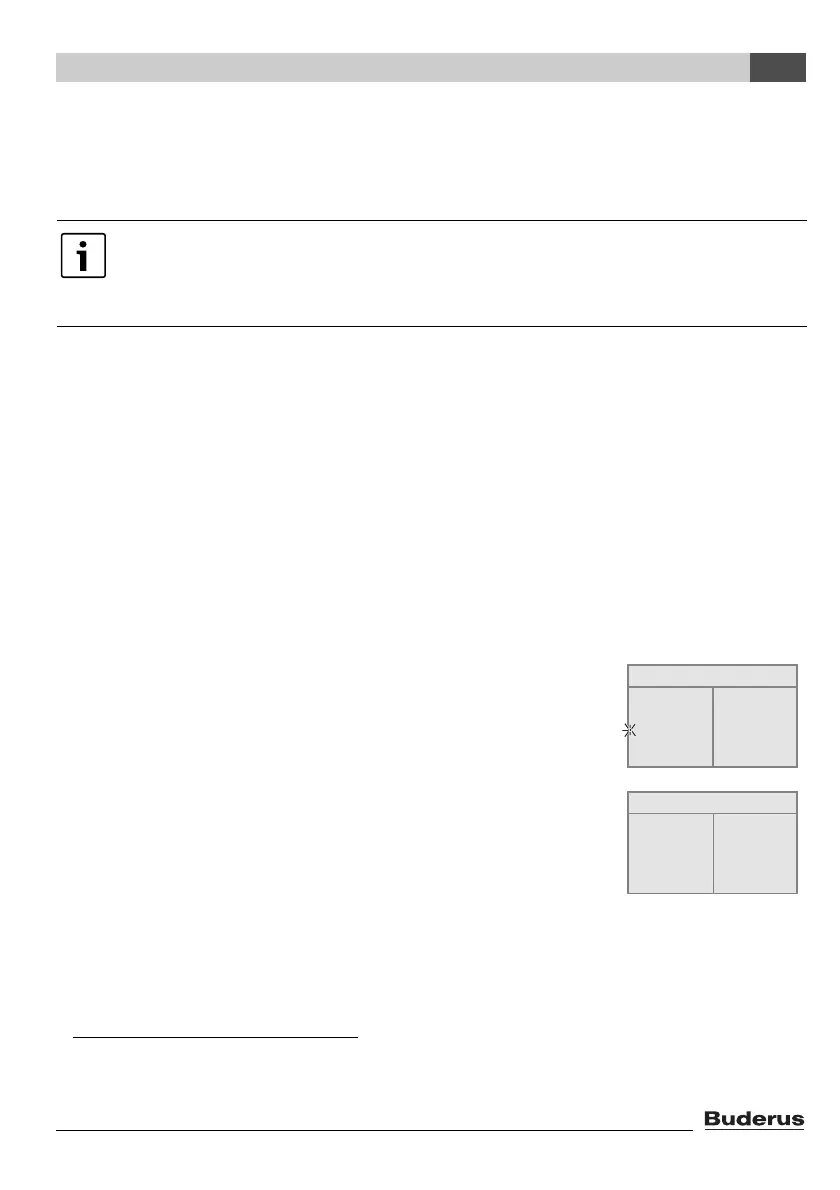
The solar gain per day and the weekly total are listed in a table: SOLAR
GAIN THIS WEEK and also for the previous week: SOLAR GAIN LAST
WEEK.
In both cases the current day is indicated by a flashing dot. This value is
updated every 15 minutes (also in the graph for the “current day”) and
the total is saved at 0:00 h as the value for the relevant day. The daily
values for the current week (MON – SUN) are also added up every 15
minutes.
The days in the current week which have not yet passed are marked with
“---”. Days for which no solar gain could be determined show “0”.
In both displays the graph is updated every 15 minutes, and a new graph is begun at
0:00 hours. For this reason no display for the current day appears between 0:00 and
0:14.
The minimum and maximum values are matched dynamically.
1) This function depends on the boiler installed.
SOLAR GAIN THIS WEEK
Mo: 10 Fr: ---
Tu: 115 Sa: ---
We: 53 Su: ---
Th: --- Mo-Su: 178
SOLAR GAIN LAST WEEK
Mo: 10 Fr: 75
Tu: 0 Sa: 102
We: 15 Su: 125
Th: 0 Mo-Su: 327

 Loading...