Using a graphic display calculator
© Oxford University Press 2012: this may be reproduced for class use solely for the purchaser’s institute
Casio fx-9860GII
ii
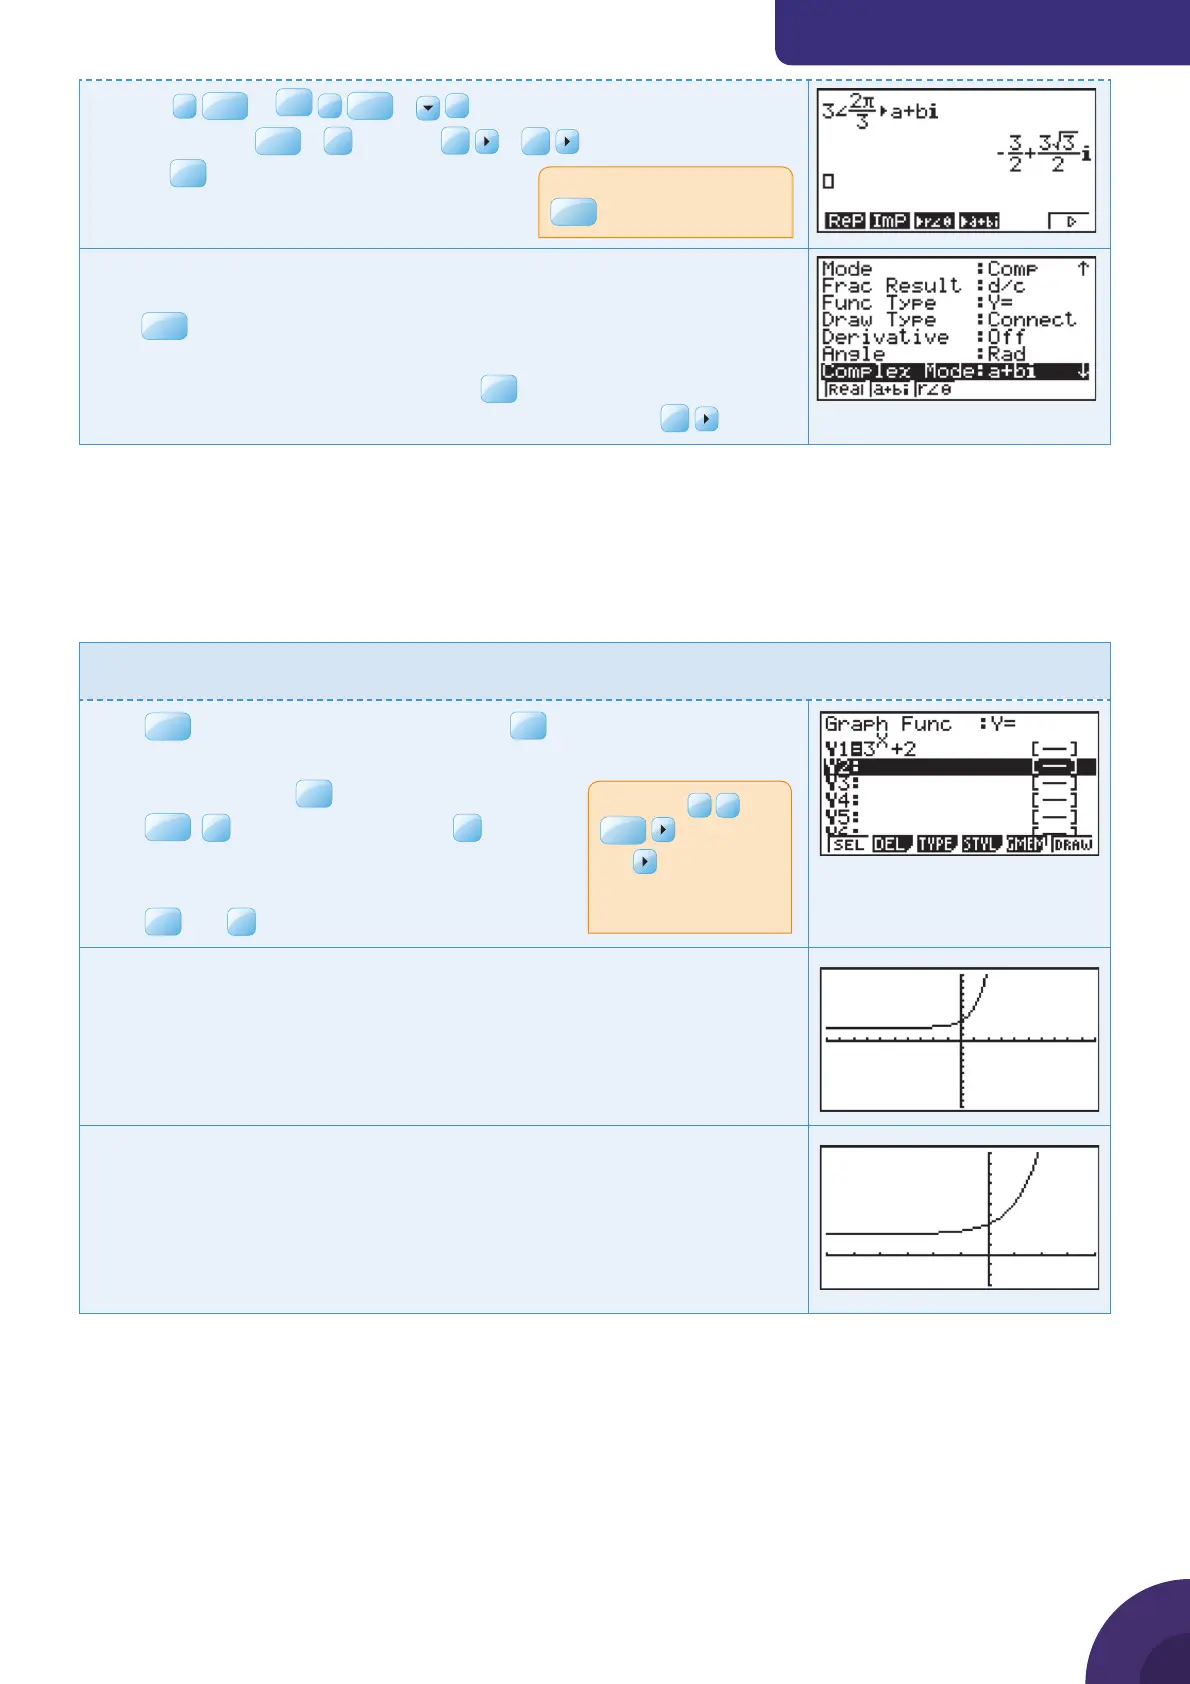
Enter
3
SHIF T
∠
a
b
/
c
2
SHIF T
π
3
and then press
OPTN
|
F3
CPLX |
F6
|
F4
a + bi
Press
You can also change the mode that the calculator uses to display complex
results in settings.
Press
SHIF T
SET UP
Select Real, Rectangular (a + bi ) or Modulus Argument (r ∠
θ
).
For example, in Polar mode, typing 2 + 2i
EXE
would result in the number
being displayed in Modulus Argument form without entering
F3
Exponential functions
1.13 Drawing an exponential graph
Example 16
Draw the graph of y = 3
x
+ 2.
Press
MENU
and choose 5: GRAPH and press
EXE
.
The default graph type is Function, so the form Y= is displayed.
Type 3
x
+ 2 and press
EXE
.
Press
SHIF T
F3
V-Window and choose
F3
STD to
use the default axes which are −10 ≤ x ≤ 10
and −10 ≤ y ≤ 10.
Press
EXE
and
F6
DRAW.
The calculator displays the curve with the default axes.
Adjust the window to make the exponential curve fi t the screen better.
The
∠
symbol is above the
X,i,T
key
Note: Type
3
>
X,i,T
to enter 3
x
.
The
returns you to
the baseline from the
exponent.
18

 Loading...


