Using a graphic display calculator
© Oxford University Press 2012: this may be reproduced for class use solely for the purchaser’s institute
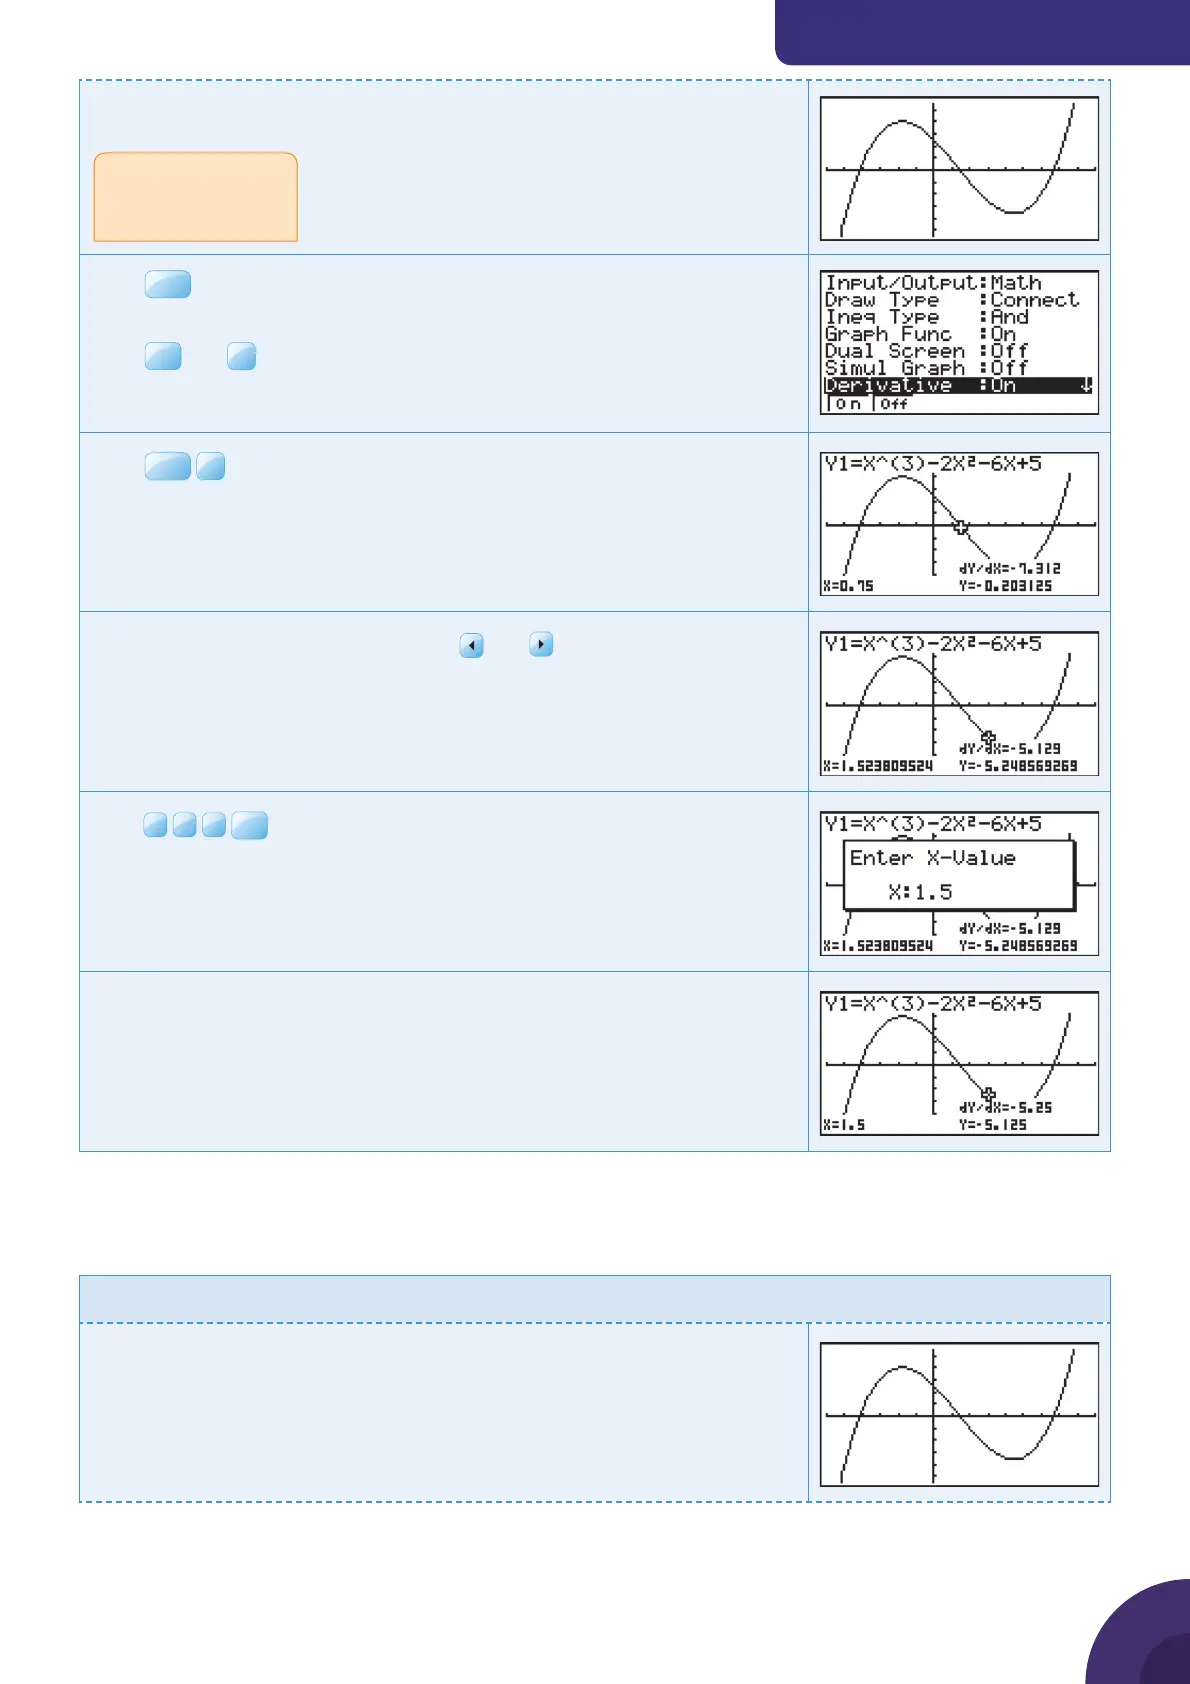
Casio fx-9860GII
Adjust the window to make the cubic curve fi t the screen better.
Press
SHIF T
(SET UP).
Set Derivative to On.
Press
EXE
and
F6
DRAW to return to the graph.
Press
SHIF T
F1
Trace.
The calculator displays the coordinates of the point and the gradient.
Move the point along the line using the and
keys.
The gradient (slope) can be found at a point that is close to 1.5.
Type
1
.
5
EXE
.
The calculator displays the gradient of the curve at the point where x = 1.5.
The gradient is –5.25.
2.2 Drawing a tangent to a curve
Example 30
Draw a tangent to the curve y = x
3
− 2x
2
− 6x + 5 where x = – 0.5.
First draw the graph of y = x
3
− 2x
2
− 6x + 5 (see Example 29).
For help with changing
axes, see your GDC
manual.
{ Continued on next page
29

 Loading...


