Using a graphic display calculator
© Oxford University Press 2012: this may be reproduced for class use solely for the purchaser’s institute
Casio fx-9860GII
1 Functions
1.1 Graphing linear functions
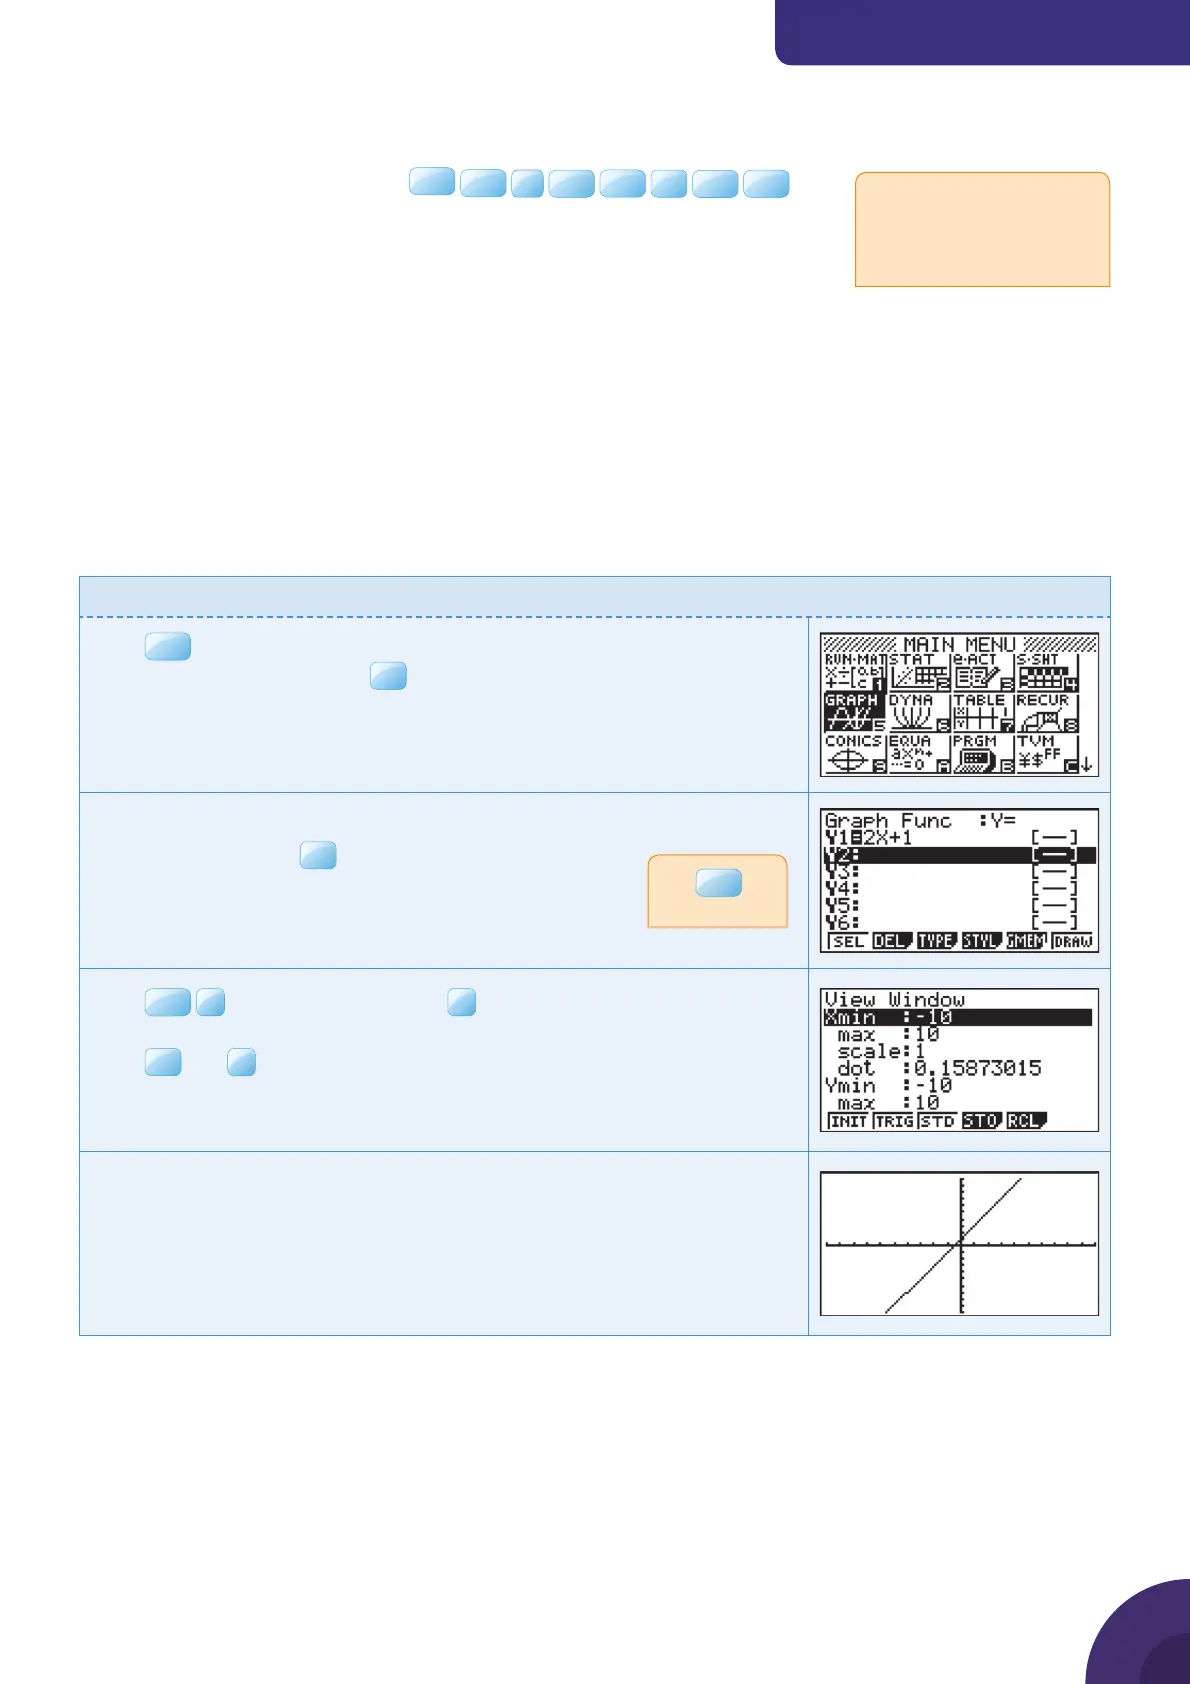
Example 1
Draw the graph of the function y = 2x + 1.
Press
MENU
. You will see the dialog box as shown on the right.
Choose 5: GRAPH and press
The default graph type is Function, so the form Y= is displayed.
Type 2x + 1 and press
Press
SHIF T
F3
V-Window and choose
F3
STD to use the default axes
which are −10 ≤ x ≤ 10 and −10 ≤ y ≤ 10.
Press
EXE
and
F6
DRAW.
The graph of y = 2x + 1 is now displayed on the screen.
Use
X,i,T
to
enter x.
Before you start
You should be familiar with:
●
Important keys on the keyboard:
AC
/ON
SHIF T
DEL
MENU
X,i,T
EXE
OPTN
EXIT
●
The home screen
●
Using the Main Menu to enter the mode you want
●
Changing window settings in GRAPH mode
●
Using zoom tools in GRAPH mode
●
Using trace in GRAPH mode
For a reminder of how to
perform the basic operations
have a look at your GDC
manual.
2

 Loading...


