Using a graphic display calculator
© Oxford University Press 2012: this may be reproduced for class use solely for the purchaser’s institute
Casio fx-9860GII
Press
SHIF T
F1
(Trace).
Use the
key to move to each of the bars and display their
value and frequency.
You should now see a frequency histogram for the data in
the list 1, 1, 3, 9, 2.
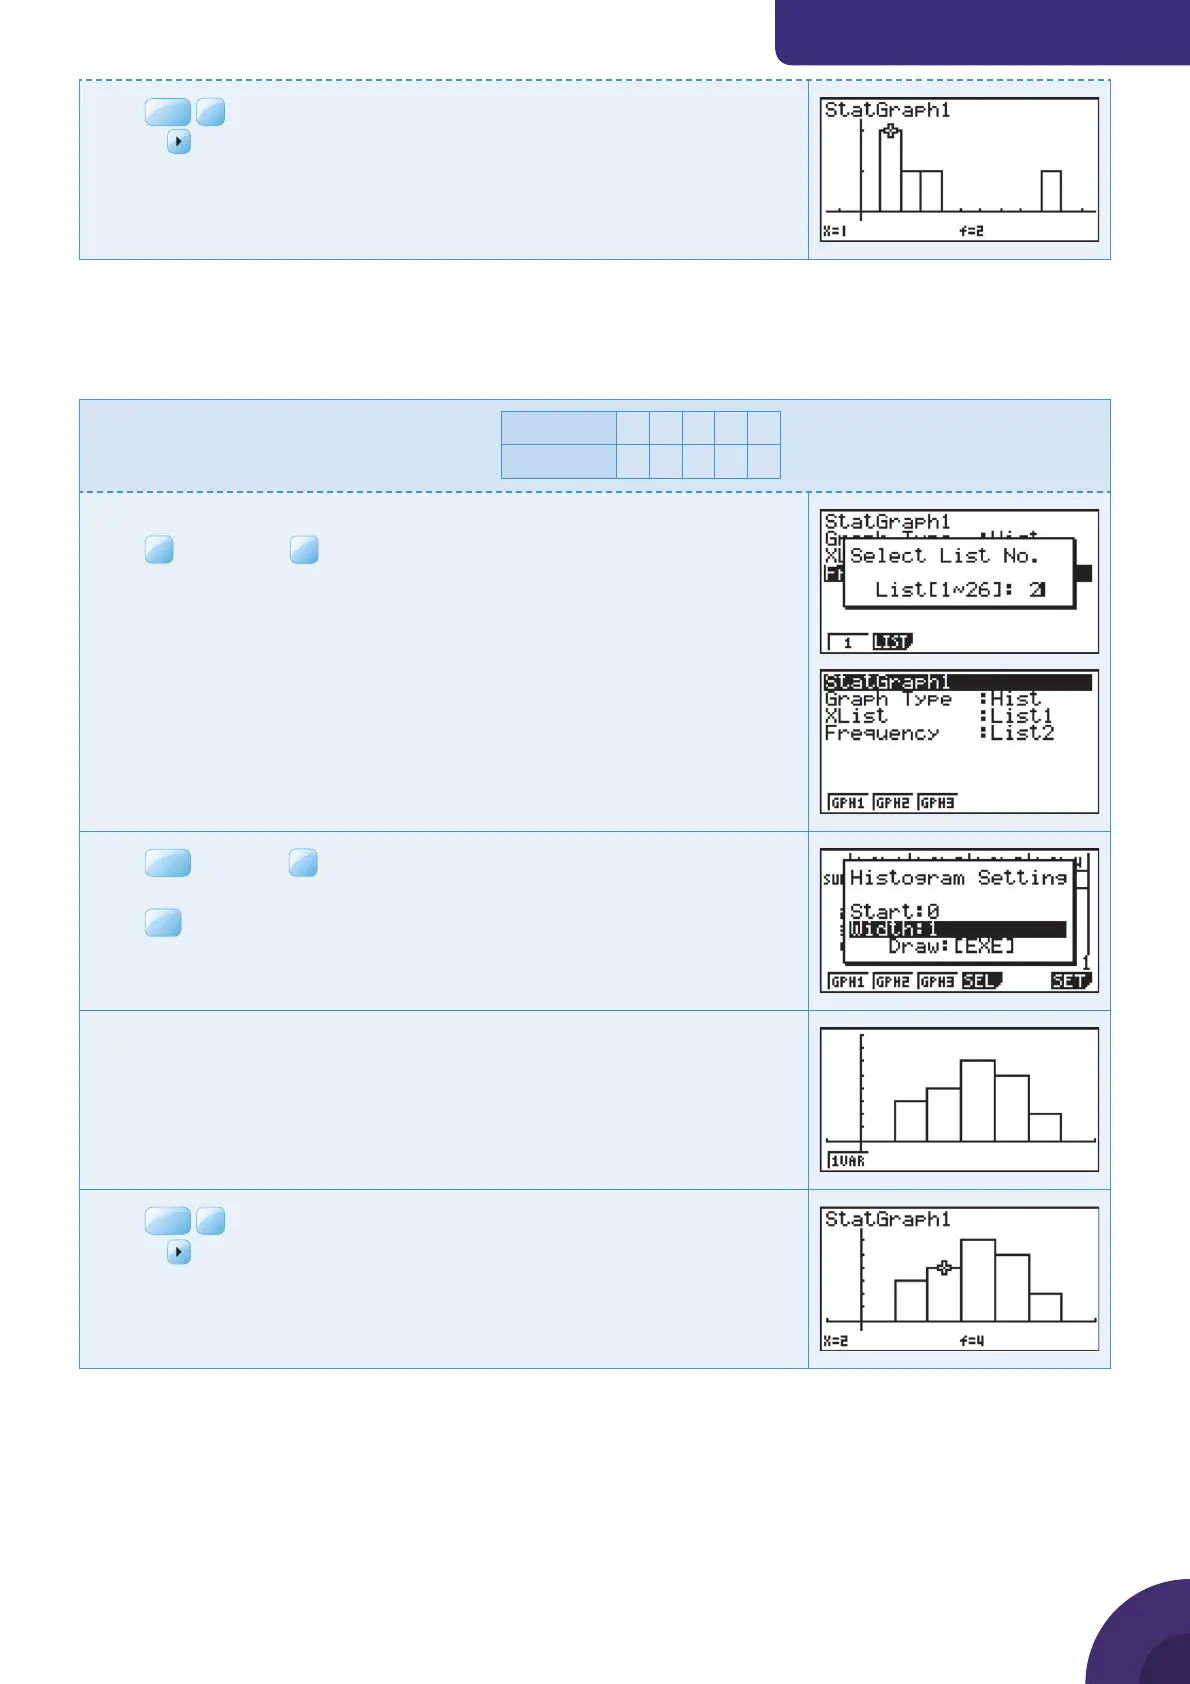
5.4 Drawing a frequency histogram from a frequency table
Example 43
Draw a frequency histogram for this data:
Number 12345
Frequency 34652
Enter the data in List 1 and List 2 (see Example 41).
Press
F1
GRPH and
F6
SET.
By default the graph type is Scatter Diagram (Scat). Change this to
Histogram (Hist). Leave XList as List 1 and set the Frequency as List 2.
You should see this display.
Press
EXIT
and press
F1
to select GPH1.
Change the start value for the histogram to 0 and the width of the bars to 1.
Press
EXE
.
A histogram, scaled for the data in the list is displayed.
Press
SHIF T
F1
(Trace).
Use the
key to move to each of the bars and display their value and
frequency.
41

 Loading...


