Using a graphic display calculator
© Oxford University Press 2012: this may be reproduced for class use solely for the purchaser’s institute
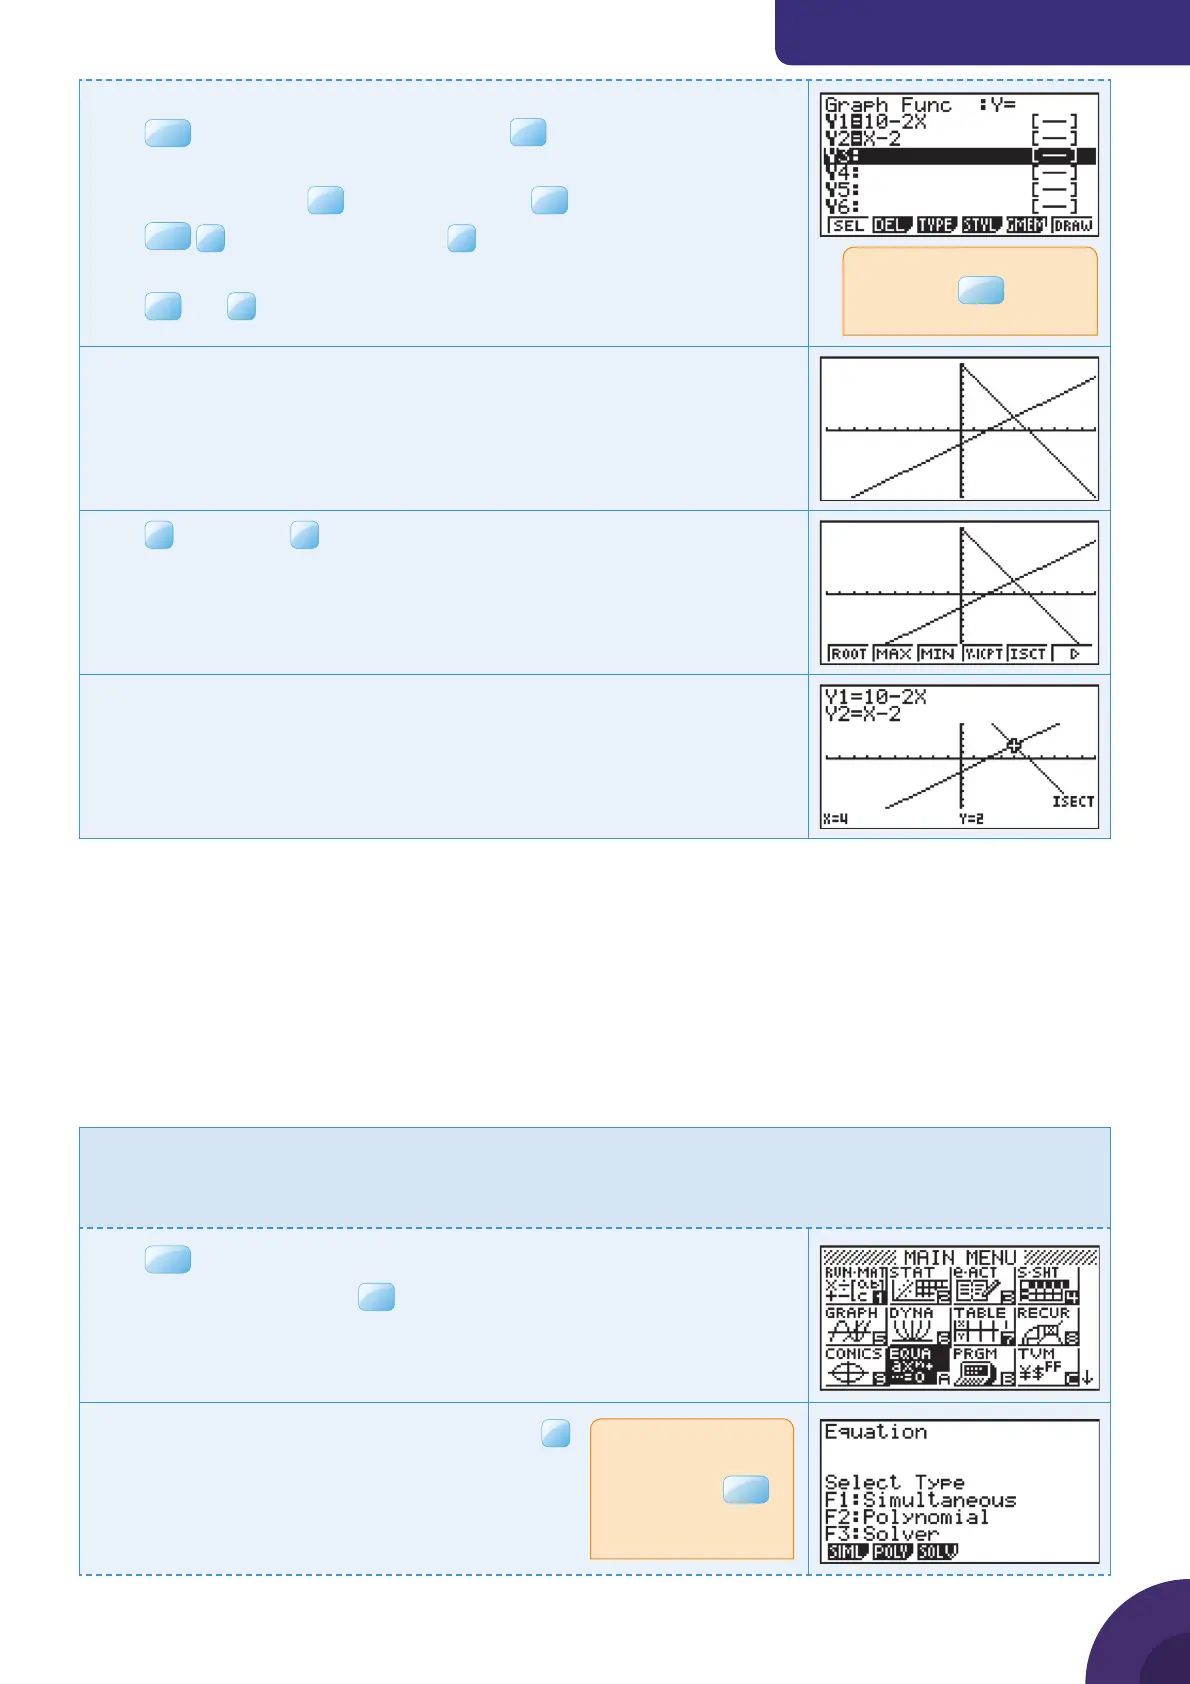
Casio fx-9860GII
To draw graphs y = 10 − 2x and y = x − 2:
Press
MENU
and choose 5: GRAPH and press
EXE
.
The default graph type is Function, so the form Y= is displayed.
Type 10 – 2x and press
EXE
and x – 2 and press
EXE
.
Press
SHIF T
F3
V-Window and choose
F3
STD to use the default axes
which are −10 ≤ x ≤ 10 and −10 ≤ y ≤ 10.
Press
EXE
and
F6
DRAW
The calculator displays both straight line graphs
Y1 = 10 – 2x and Y2 = x – 2.
Press
F5
G-Solv and
F5
ISCT.
The calculator displays the intersection of the two straight lines at the
point(4, 2).
The solutions are x = 4, y = 2.
Simultaneous and quadratic equations
1.4 Solving simultaneous linear equations in two unknowns
When solving simultaneous equations in an examination, you do not need to show any
method of solution. You should simply write out the equations in the correct form and then
give the solutions. The calculator will do all the working for you.
Example 4
Solve the equations:
2x + y = 10
x − y = 2
Press
MENU
. You will see the dialog box as shown on the right.
Choose A: EQUA and press
From the menu, choose Simultaneous and press
If the calculator displays a
graph, press
EXIT
to return
to this screen.
If there are previous
equations in the
memory, press
EXIT
until you return to this
menu.
{ Continued on next page
4

 Loading...


