Using a graphic display calculator
© Oxford University Press 2012: this may be reproduced for class use solely for the purchaser’s institute
Casio fx-9860GII
Press
SHIF T
F1
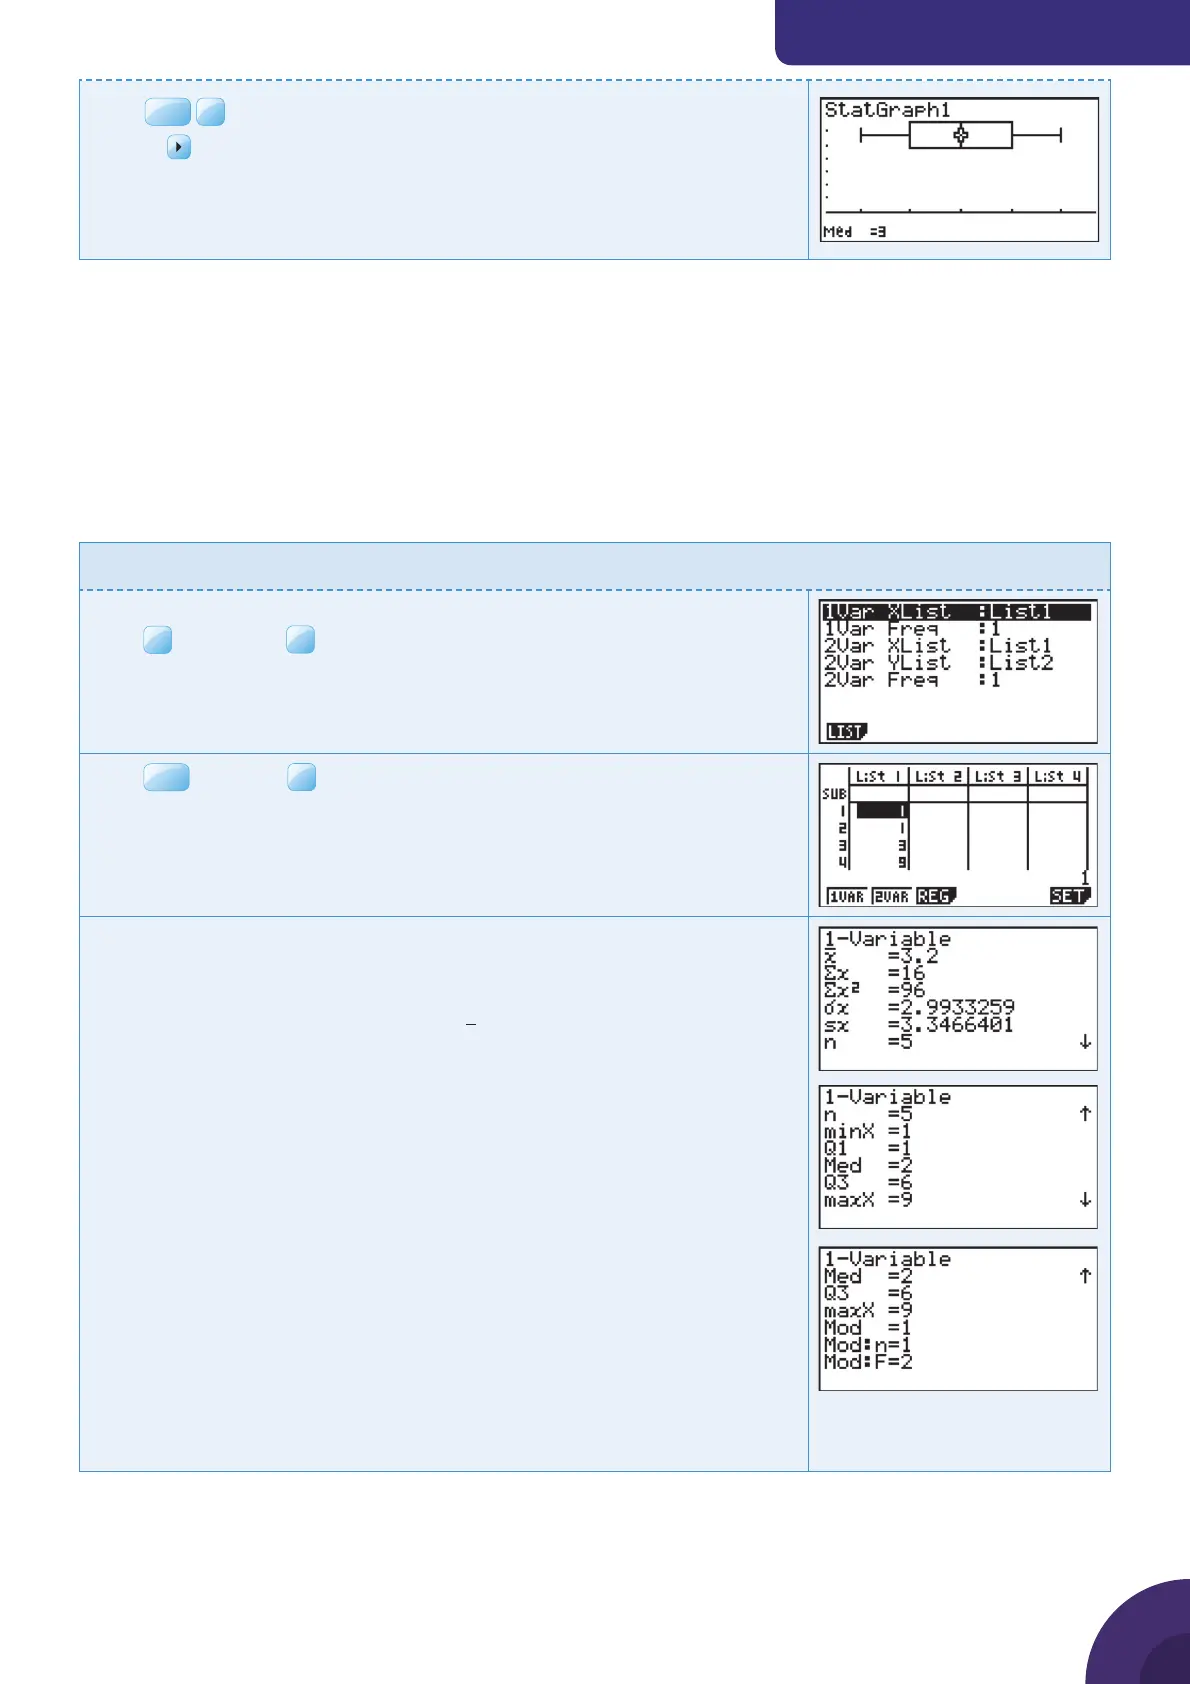
(Trace).
Use the
key to move the cursor over the plot to see the quartiles, Q1 and
Q3, the median and the maximum and minimum values.
Calculating statistics
You can calculate statistics such as mean, median, etc. from a list,
or from a frequency table.
5.7 Calculating statistics from a list
Example 46
Calculate the summary statistics for this data: 1, 1, 3, 9, 2
Enter the data in List 1 (see Example 40).
Press
F2
CALC and
F6
SET.
Use the default values for 1 variable statistics which are XList as List 1
and Freq as 1.
Press
EXIT
and press
The information shown will not fi t onto a single screen.
You can scroll up and down to see it all.
The statistics calculated for the data are:
mean
x
sum ∑ x
sum of squares ∑ x
2
population standard deviation
σ
x
sample standard deviation Sx
number n
minimum value minX
lower quartile Q
1
median Med
upper quartile Q
3
maximum value maxX
mode Mod
number of data mode items Mod:n
data mode frequency Mod:F
43

 Loading...


